
Athlete Profiles - Flohockey
This project will focus on the design and creation of athlete profiles for FloSports, specifically in the context of FloHockey, one of the top live-streamed sports within the Flo product umbrella.
Below is an interactive Figma prototype of the iOS Athlete Profile designs, as well as the direct prototype link.
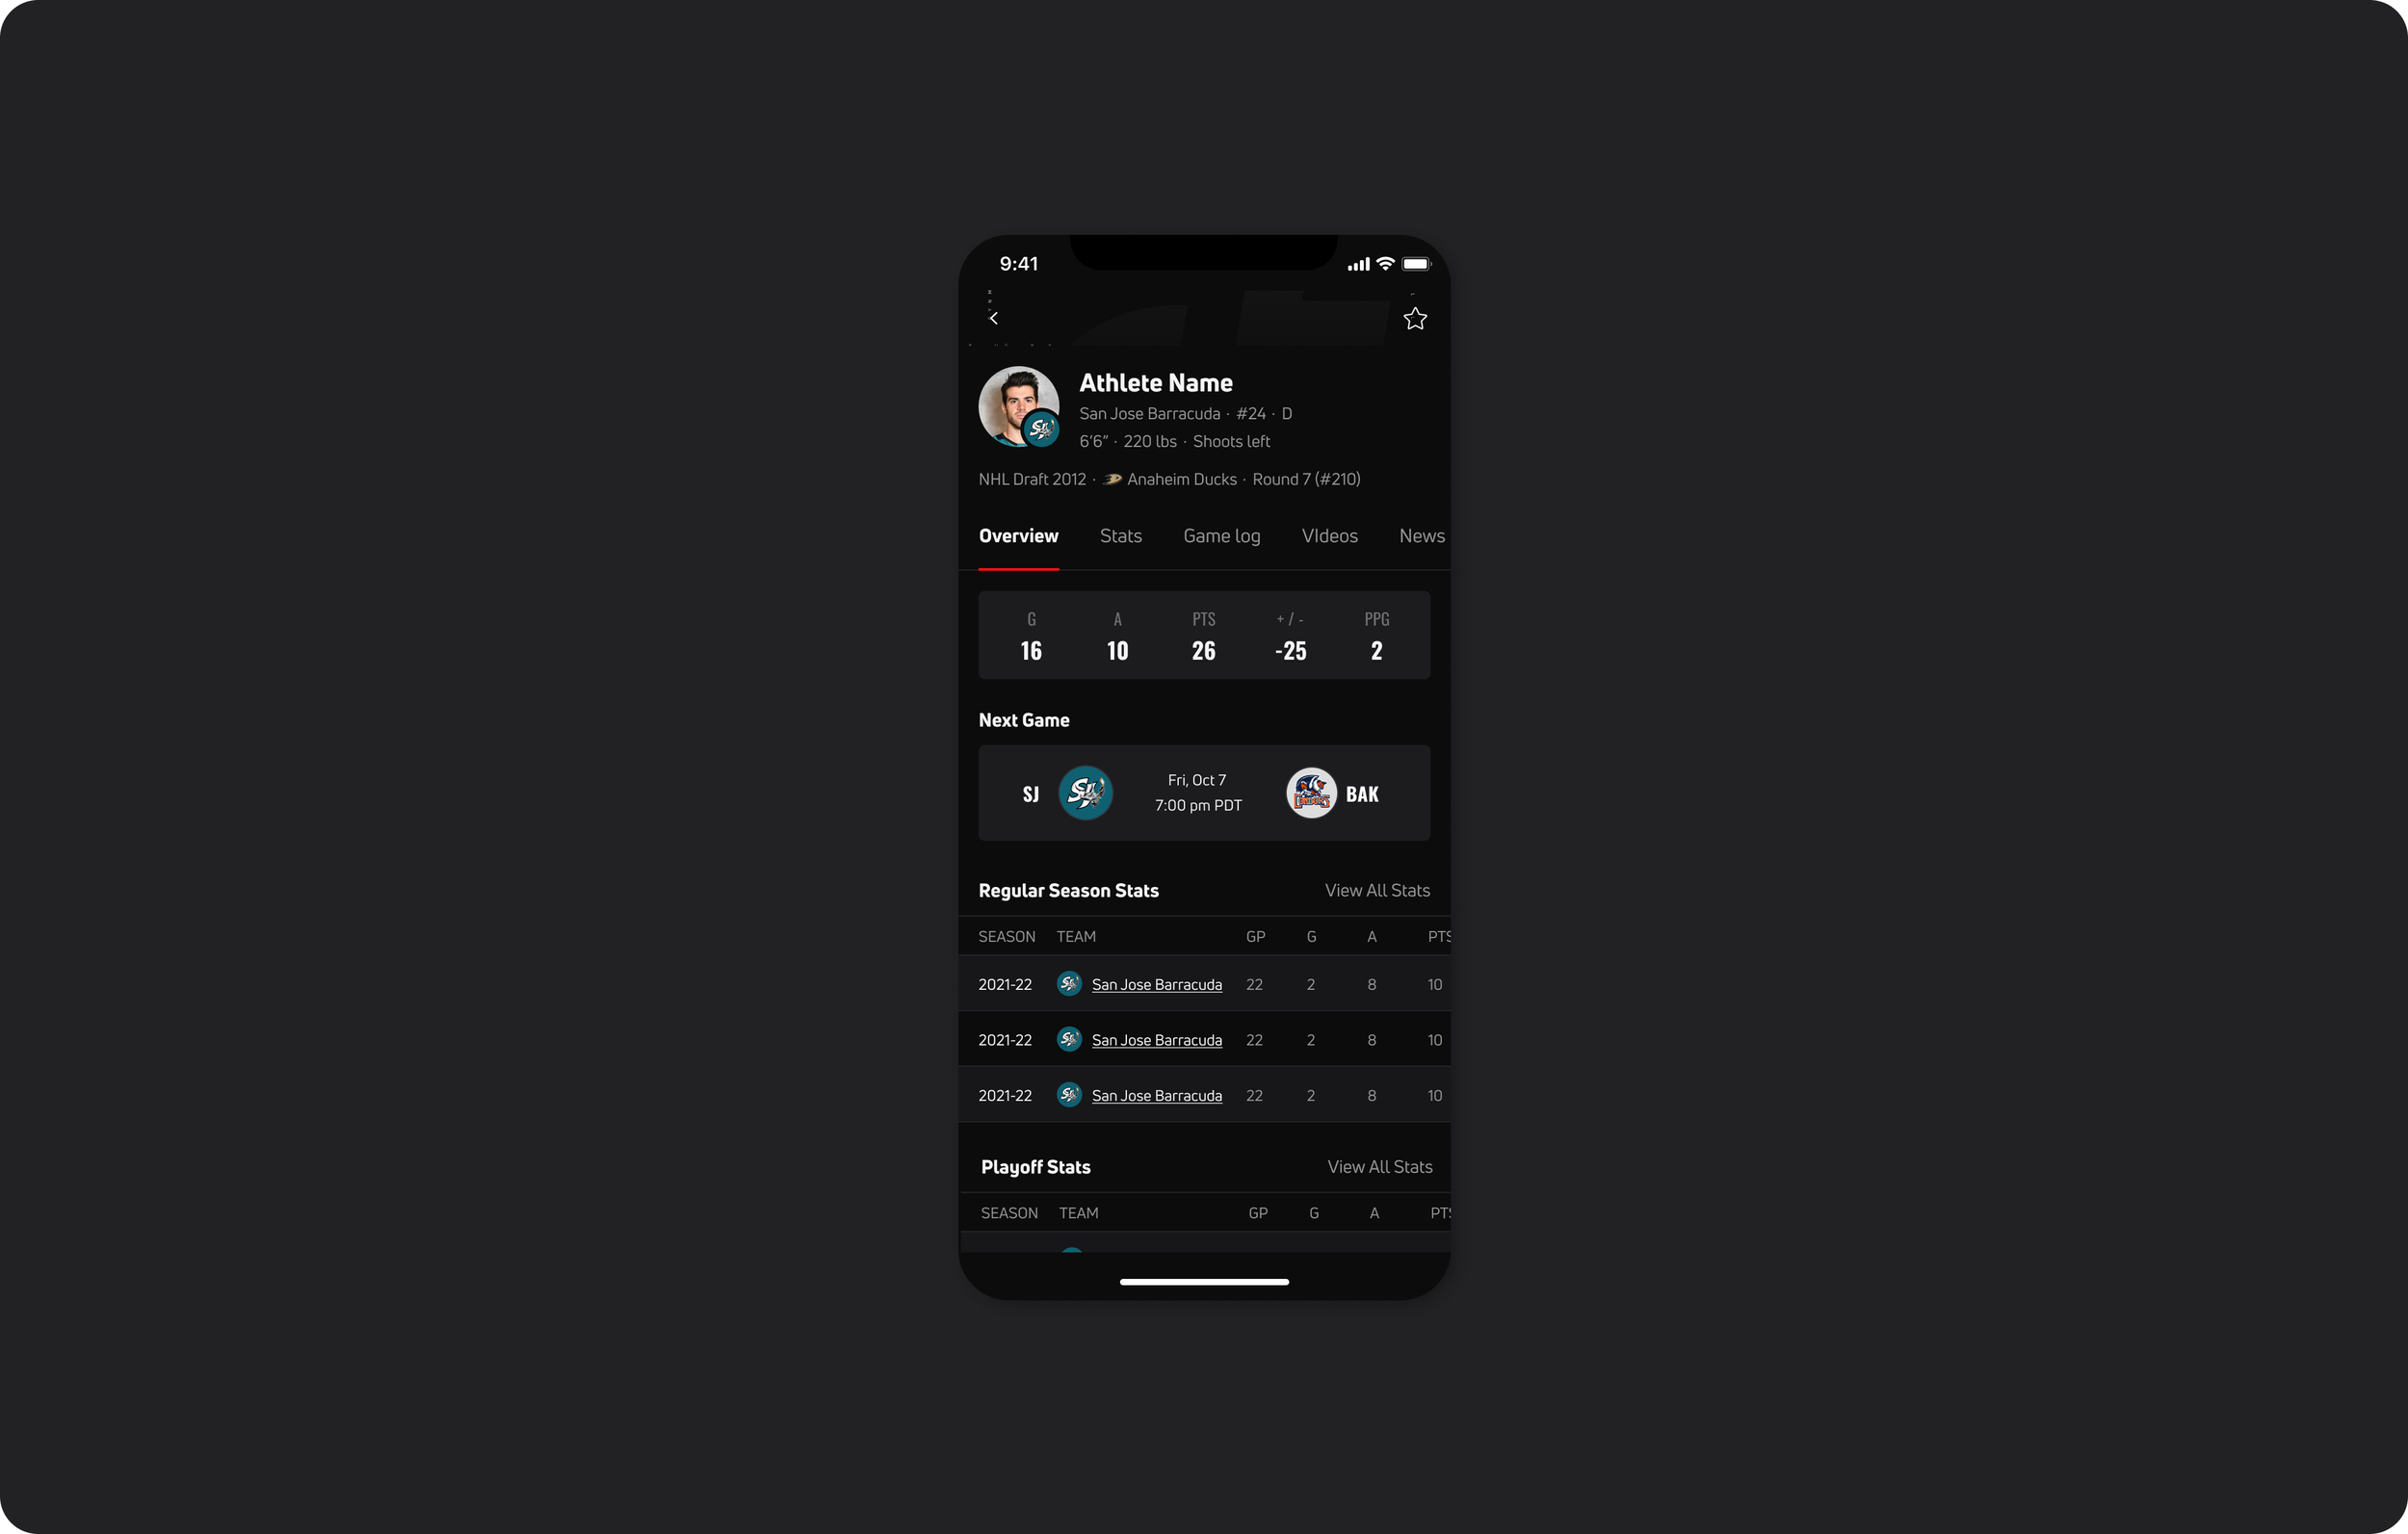
background
In 2022, FloSports acquired HockeyTech, a leader in hockey industry real-time data and live streaming experiences. The creation of athlete profiles was the first project to come from this merger.
Although created within the context of hockey, these profiles were designed as scaleable templates to be utilized within all applicable FloSports products (i.e sports that feature athlete stats like wrestling, grappling, track, etc.) These x-platform designs were created for our responsive web, iOS, and Android apps.
Prior to the creation of these athlete profiles, it was imperative for to create the overarching information architecture and navigation which form the foundation of these “entity collection” pages. For additional context and background, reference the entity collection IA project for a deeper dive into the creation of these templates. The designs for athlete profiles reside within this new framework.
My role involved designing the global x-platform experience for iOS, Android and responsive web. The process initially began with mobile web designs followed by responsive web designs and native apps. Shown below is the glance at the cross-platform designs.
goal
The primary goal of this project is to create a data-rich and dense athlete profile. The exposure of data within athlete profiles allows FloSports to get one step closer in becoming the essential destination for hockey fans. Following is a closer look at the page structure and foundational components designed for this x-platform experience, from the top-down.
header
With the header as the top-level page item, and ever present across all tabs, it was imperative to design a component that not only provided navigational value to our users, but an invitation for further exploration.
At minimum, each athlete profile displays the athlete name, team, and sport-specific metadata (position, player number, etc). Provided the existing assets, these profiles display the athlete photo and corresponding team logo [Simplified component variants were designed anticipating lack of logos/photos in the database]. Beside these elements, the user has the option to favorite the athlete through a primary CTA.
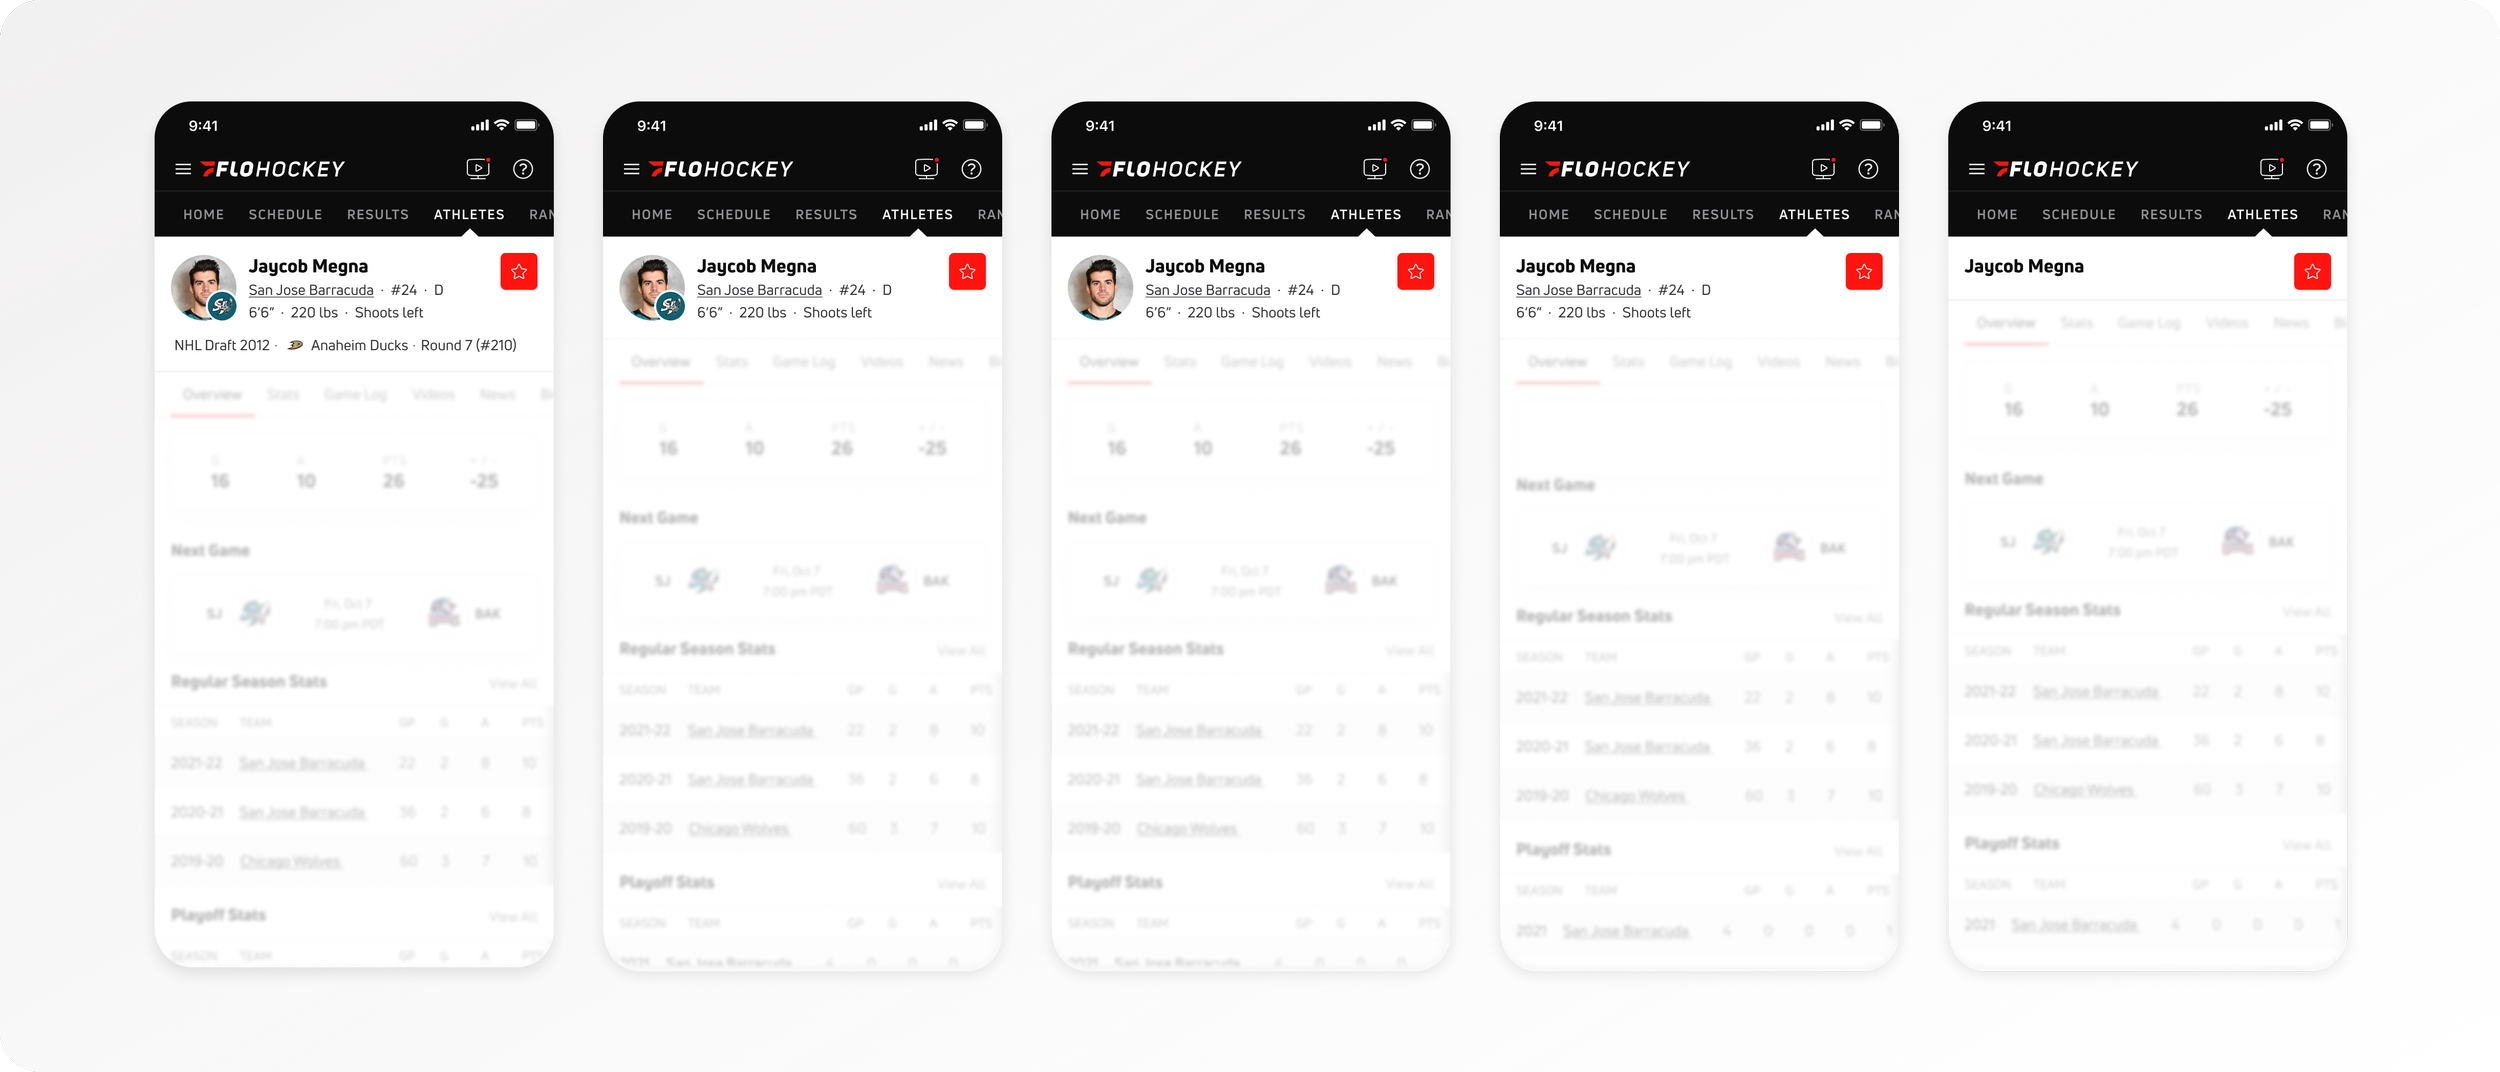
header variants from most data-rich to least (left to right)
The header component is followed by the athlete profile sub-navigation, consistent with the previously established pattern for entity collections. This entity-specific sub-navigation features a horizontal tab scroll in the following order: Overview, Stats, Game log, Videos, News, and Bio.
Also note that all the designs showcase placeholder data to display edge cases, not indicative of actual player data.
overview tab
The overview tab houses the data summary of the athlete’s most recent season serving as a discovery landing page. It’s the starting point for the user to further explore the richer data found within the profile tabs. It’s the first chance to hook the user into further exploring the content within these pages.
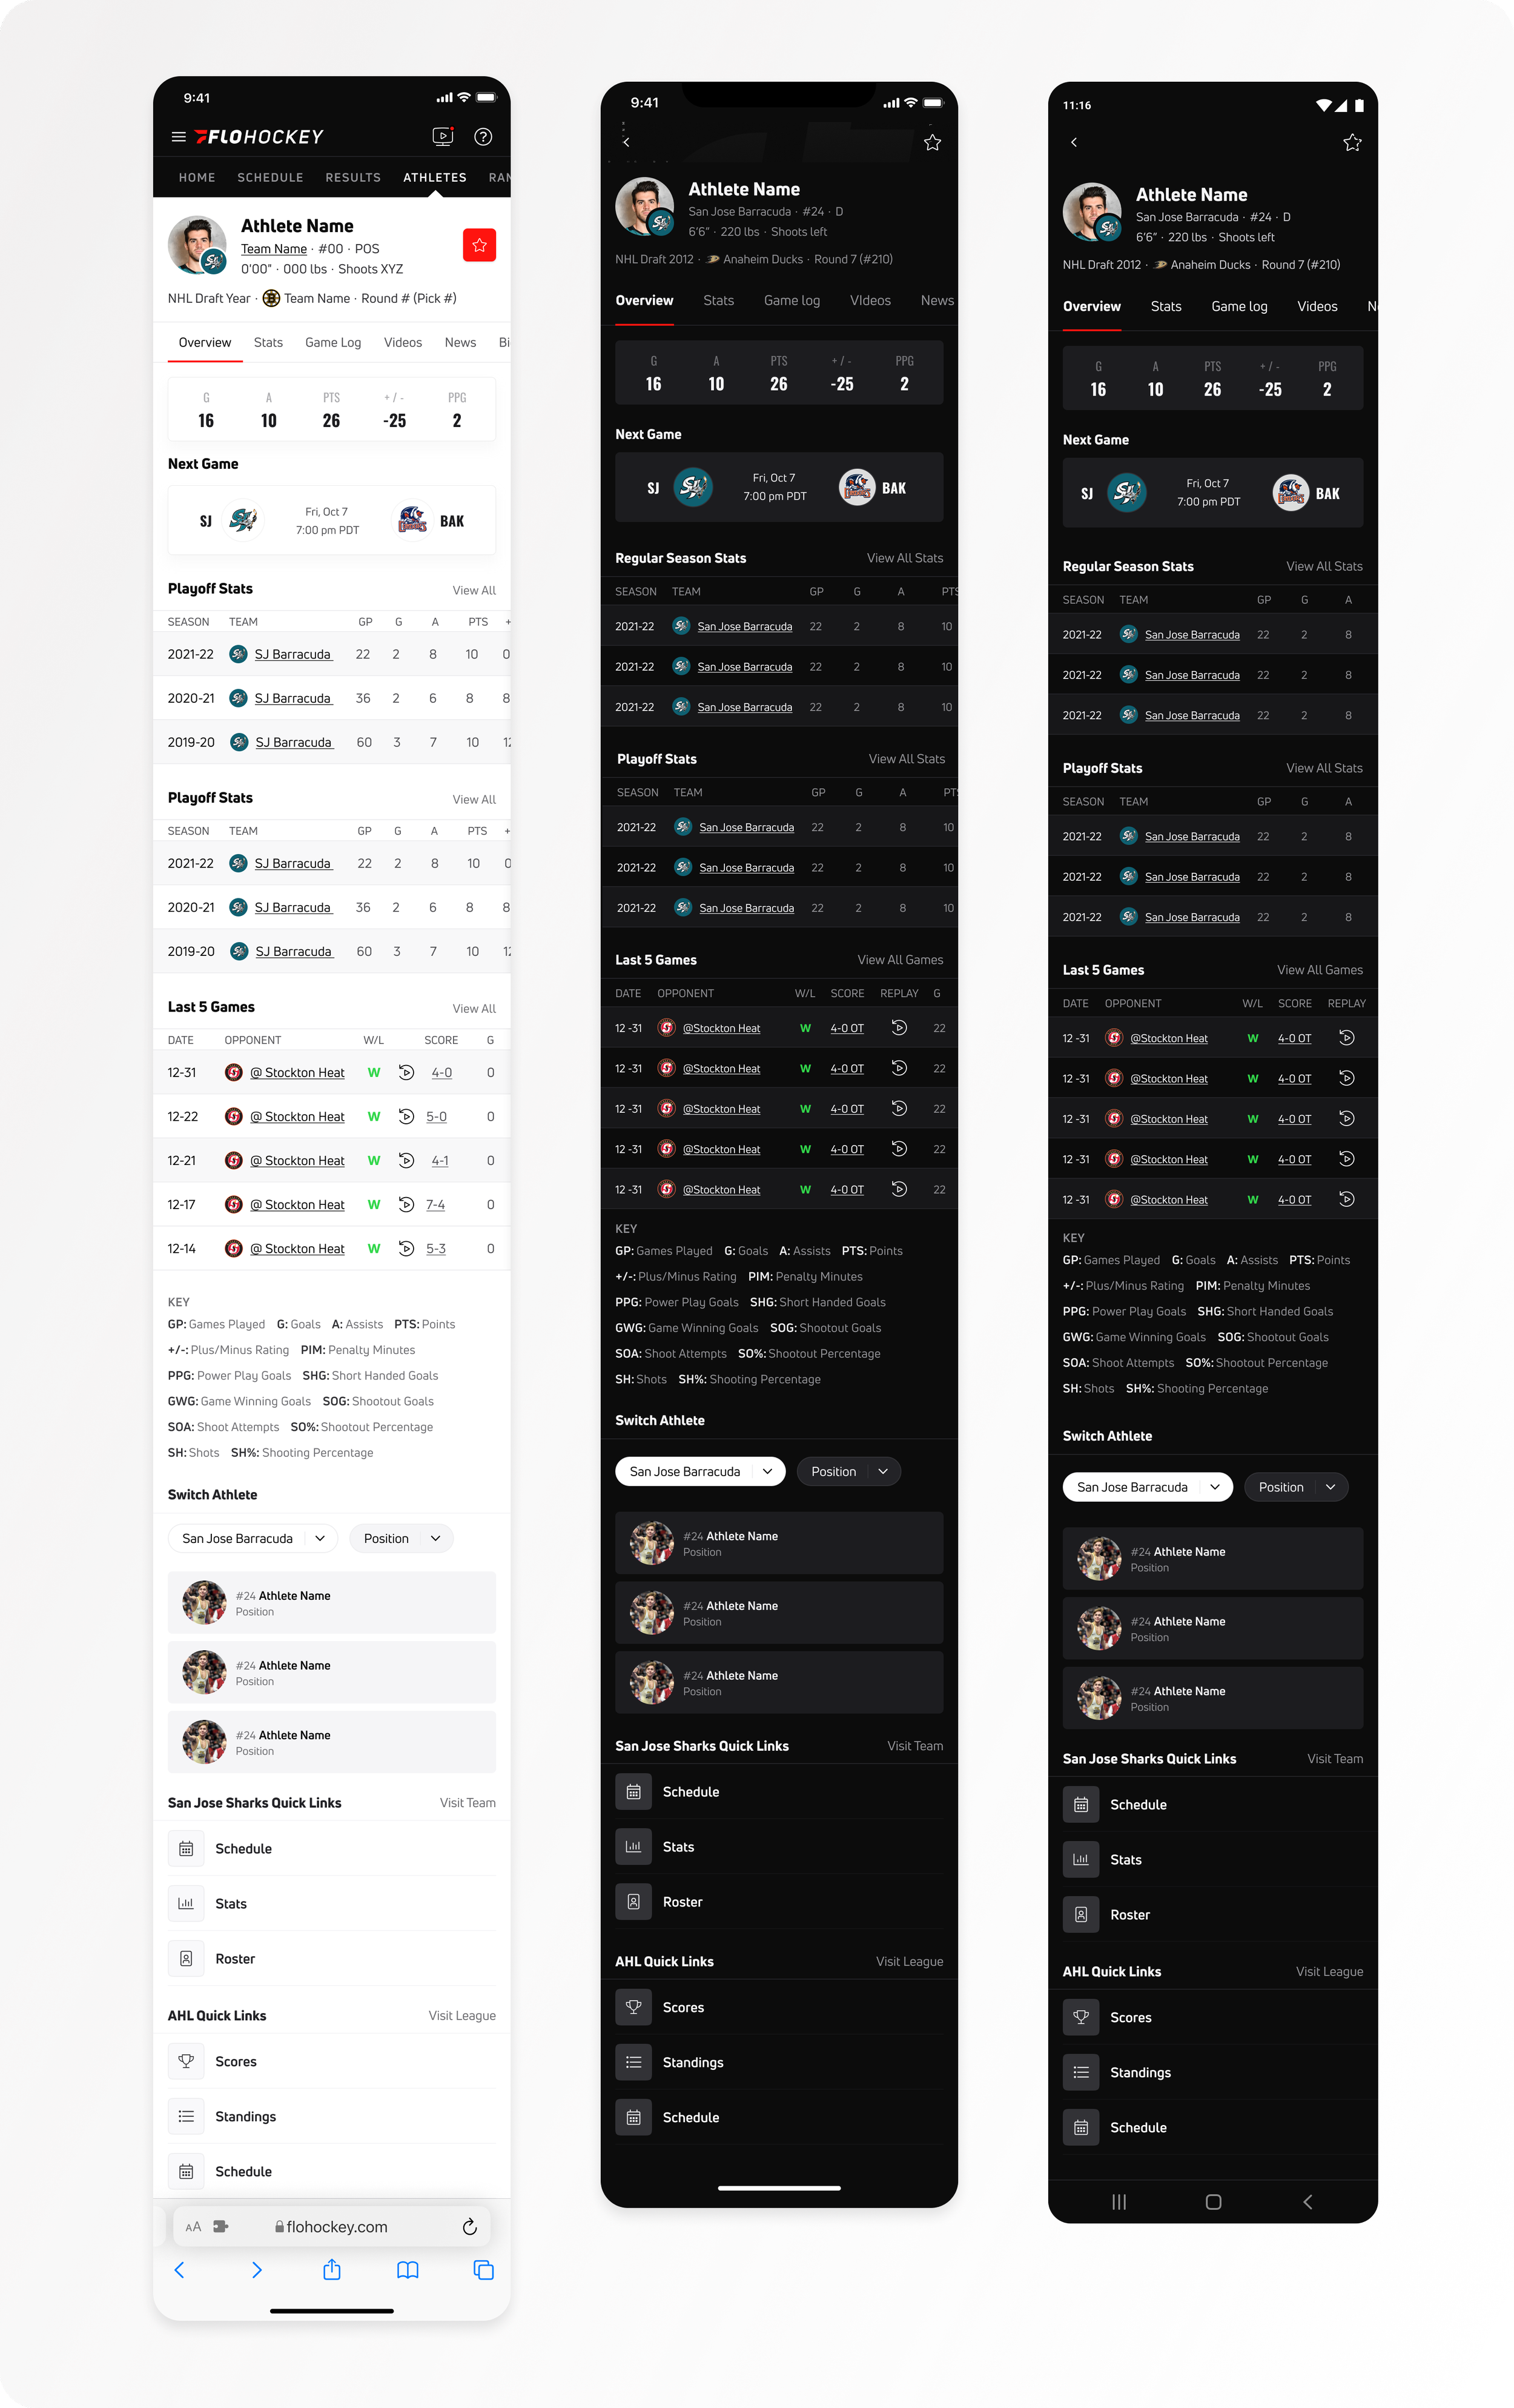
mobile web — iOS — Android x-platform viewports for the Overview tab
Season stat summary component
This component features key stats from an athlete’s most recent or present season. Flexibly designed, it allows for the addition or removal of a stat element, up to five if desired. A competitor analysis showed the most commonly displayed stats to be Goals (G), Assists (A), Points (PTS), and Plus-Minus Rating (+/-). I the examples provided, four key stats are displayed.
Next Game component
This component showcases an upcoming game pertaining to the athlete’s team. It displays the competing teams, logos, and game start date/time. When the game is live, a live badge is displayed to draw the user’s attention, and the date information is updated to reflect this status. A component we were considering for the v2 follows was a [Most Recent Game] component which would route the user to the last game the athlete competed in.
Because this component only displays the competing teams, an not directly tied to the athlete, it is incorporated in other aspects of the product, such as relevant team and league pages.
Table stat summary components
Below the “Next Game” component is the a tabular summary of the athlete’s most recent season stats. These tables provide a quick preview of the entire table data displayed on the Stats tab, using a [View All] link to navigate users directly to that page.
We showcase the three most recent seasons for regular and playoff season stats with considerations of certain edge cases. For instance, if an athlete played in 1-2 total seasons, we still redirect the user to the main Stats tab, anticipating the athlete’s game history continuing to build in future years. The goal was also to establish a consistent navigational pattern across athlete profiles through this flow.
Following the season and playoff stats tables, a data summary of the athlete’s last 5 competed games is displayed, redirecting the user to the main page via the [View All] link.
A legend follows any table with its corresponding abbreviation definitions.
Switch Athlete module
This component allows the user to maintain immersed within the athlete/teams landscape while navigating between parallel pages.
Using the filter dropdown, the user can view any athlete from any team within their specific league. They also have the option to filter down based on position type.
By default, the current athlete profile’s team filter is preselected to display their team members prior to any filter selection. This list is auto-populated by displaying the top 3 high-page-trafficked athletes for this component.
Quick Links
Below the [Switch Athlete] module, are the “quick links” to the athlete’s respective team and league. These links were set based on our product prioritizes and studies of user behavior. These links allow for further exploration into the product directly routing users to popular pages, serving to reduce the friction of browsing for the proper navigation items.
athlete type variants
One consideration to keep in mind with these designs is that I’m showing examples for a typical hockey skater profile. Content/data for a goalie differ in terms of featured data and the corresponding results, as well as for an athlete within another sport entirely. Such athlete variants were accounted for in the creation of these designs. The layout and structure of these pages remains consistent regardless of the player type.
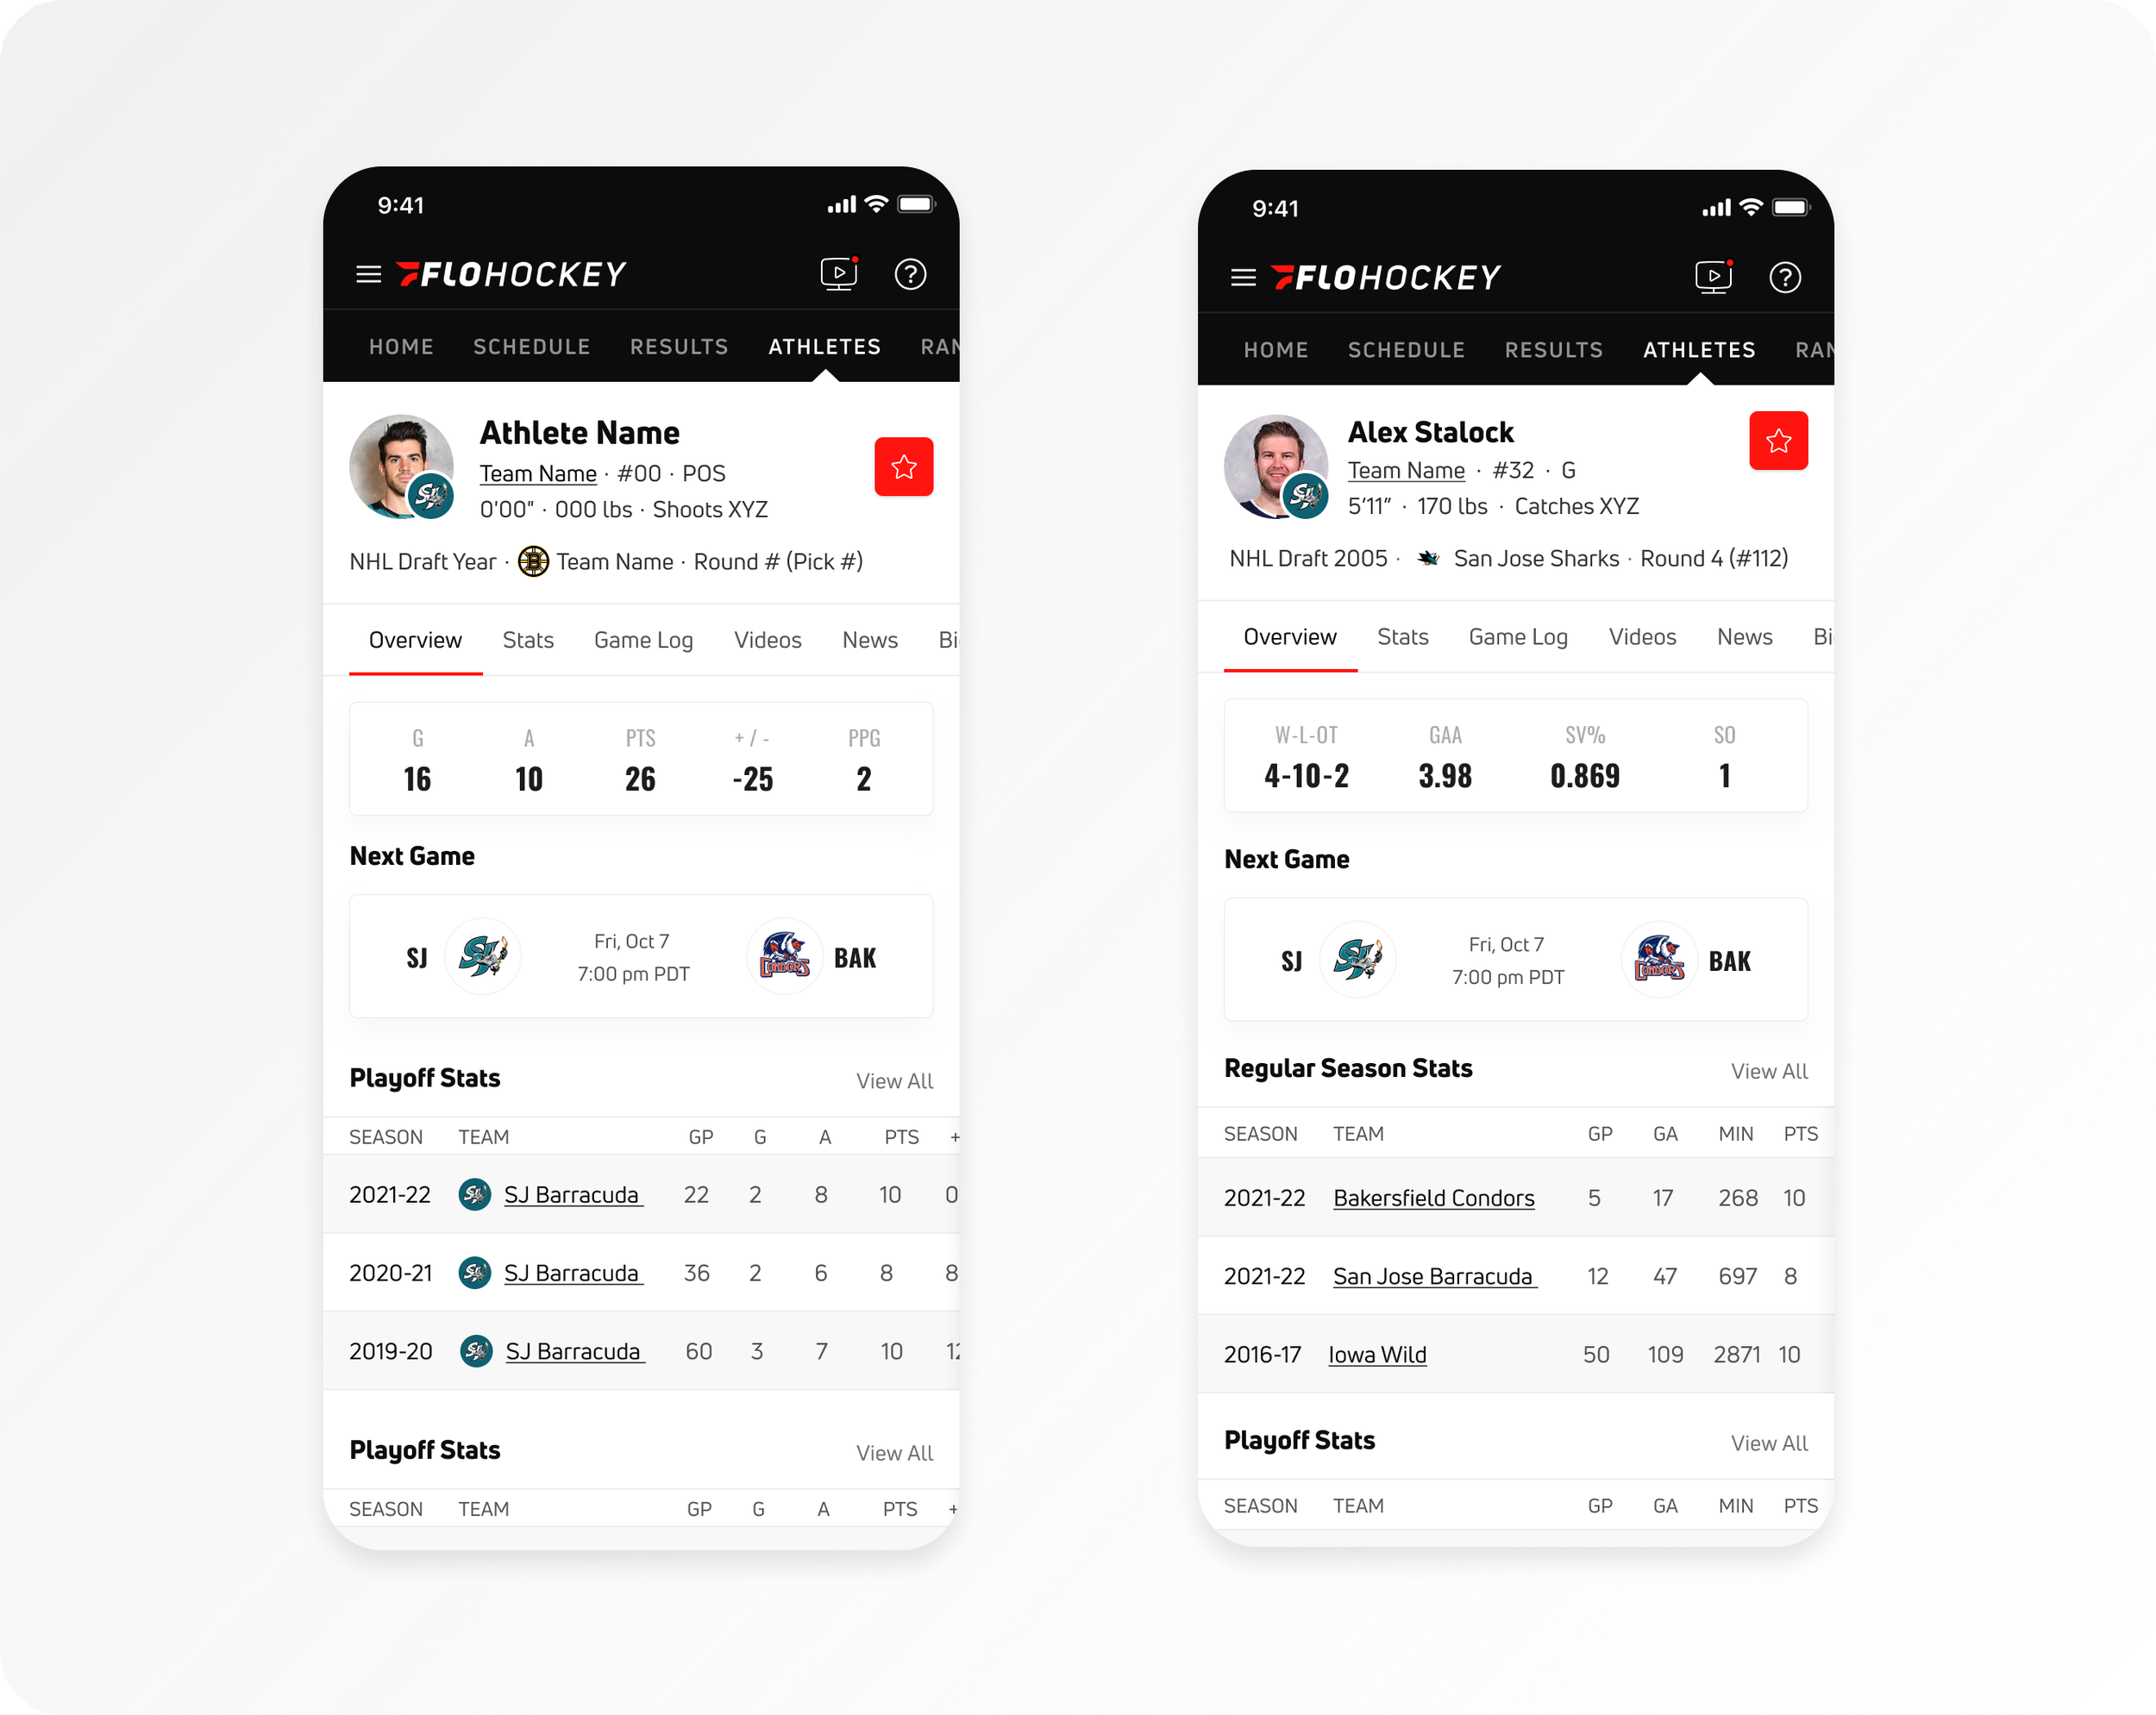
examples of player variants — skater (left) vs. goalie (right)
stats tab
The contents within the Stats tab are data tables with a season filter. The stats displayed depend on the whether the athlete type/position and sport, but the basic structure is consistent and independent of the athlete’s association.
Upon default page load, an index page displays all tables stacked vertically in reverse chronological order. The season filter allows the user to navigate between various tabular data types — in hockey’s case between the regular season and playoff stats.
The data within the table itself depends on the sport. For hockey, this houses the athlete’s historical stats within a specific league. When relevant to the data set, table columns link users to other products pages, such as teams or league pages.
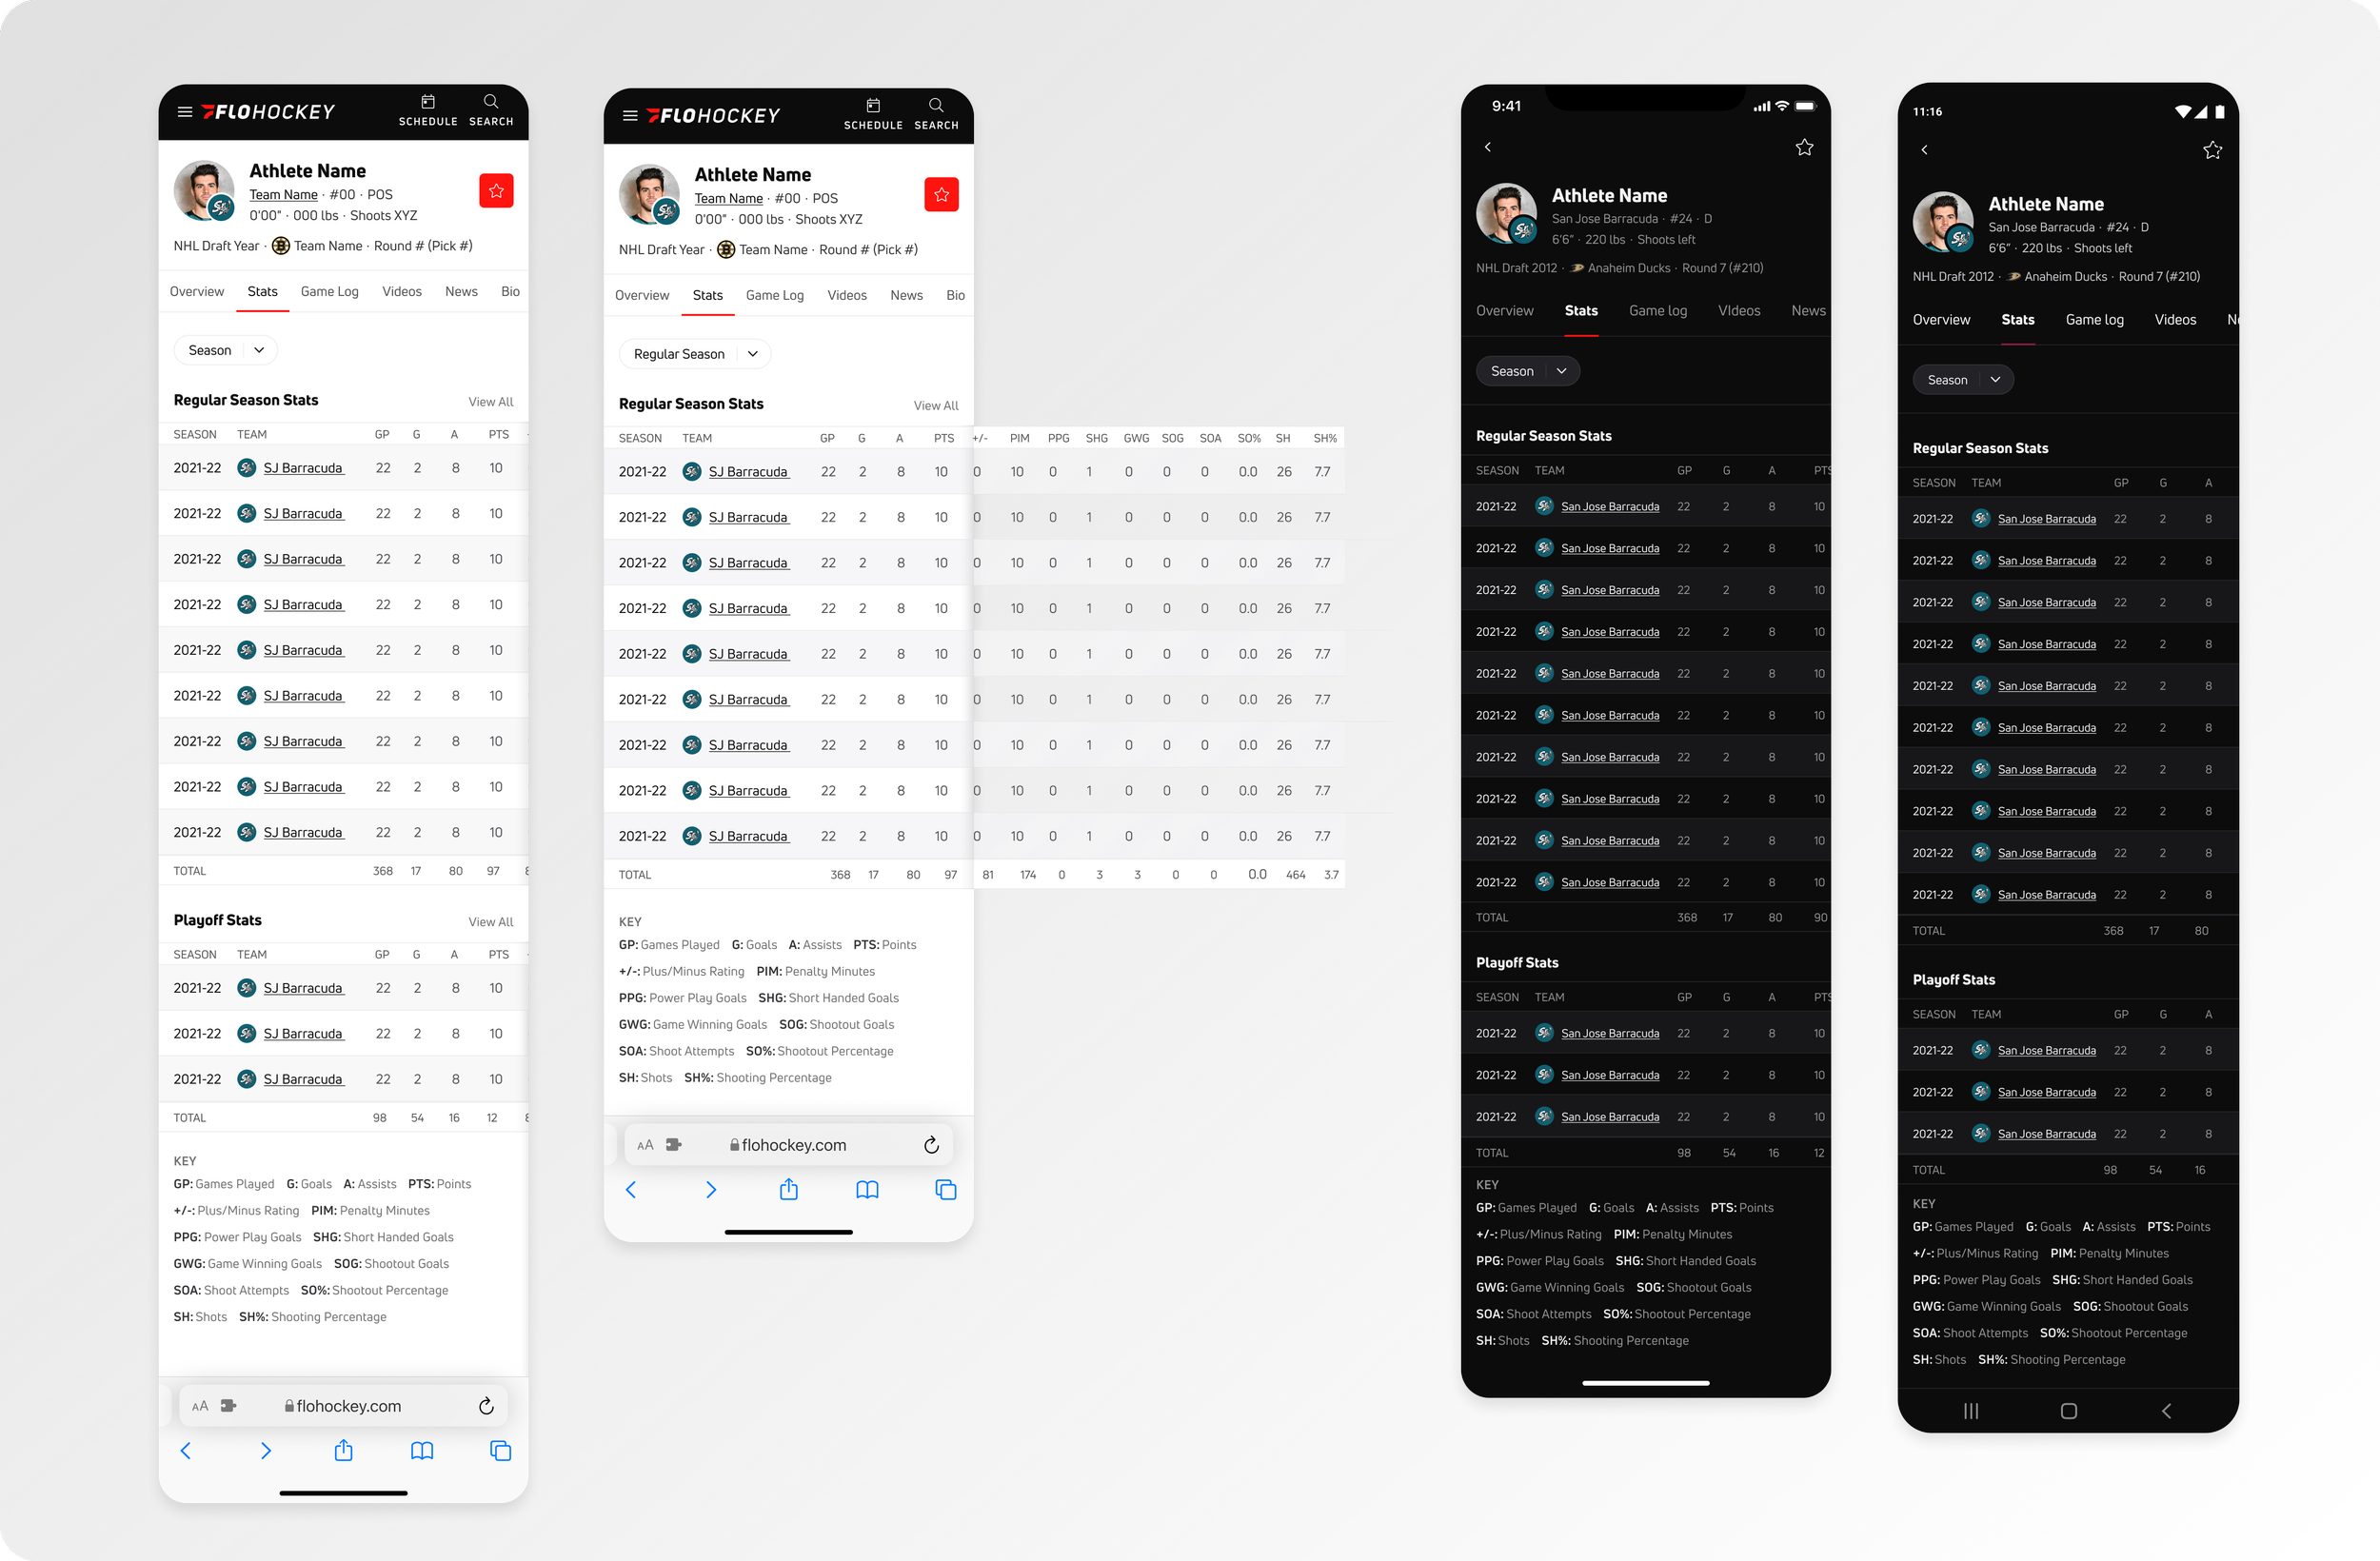
stats tab for web + expanded table, iOS, Android screens
For context, we designed this table component from a previous Flo project. An expanded view is shown below of regular seasonal stats alongside the native counterparts. The table horizontally scrolls allowing users to view this. It also provides vertical sorting if a user wants to highlight and focus on a specific column as they scroll through the data.
A consideration for all tables is the team name display — some teams may have abbreviations while others may not, and we foresaw those edge cases. To accommodate lengthy team names, we display the team abbreviation when the max character count for the table cell is reached — team name abbreviations are on average 3 characters, maxing at 5 at most.
game log tab
Similar to the Stats tab, the Game log tab features tabular filter-dependent data. The user can choose to filter by year or season type, or view the entire data set altogether prior to filter application.
The game log features an athlete’s entire game history, and data collected during each played game. This is important historical data for any athlete and athlete fans as we show when the game was played, the competing team, final score, and a replay link to rewatch that event, in addition to all the numerical data.
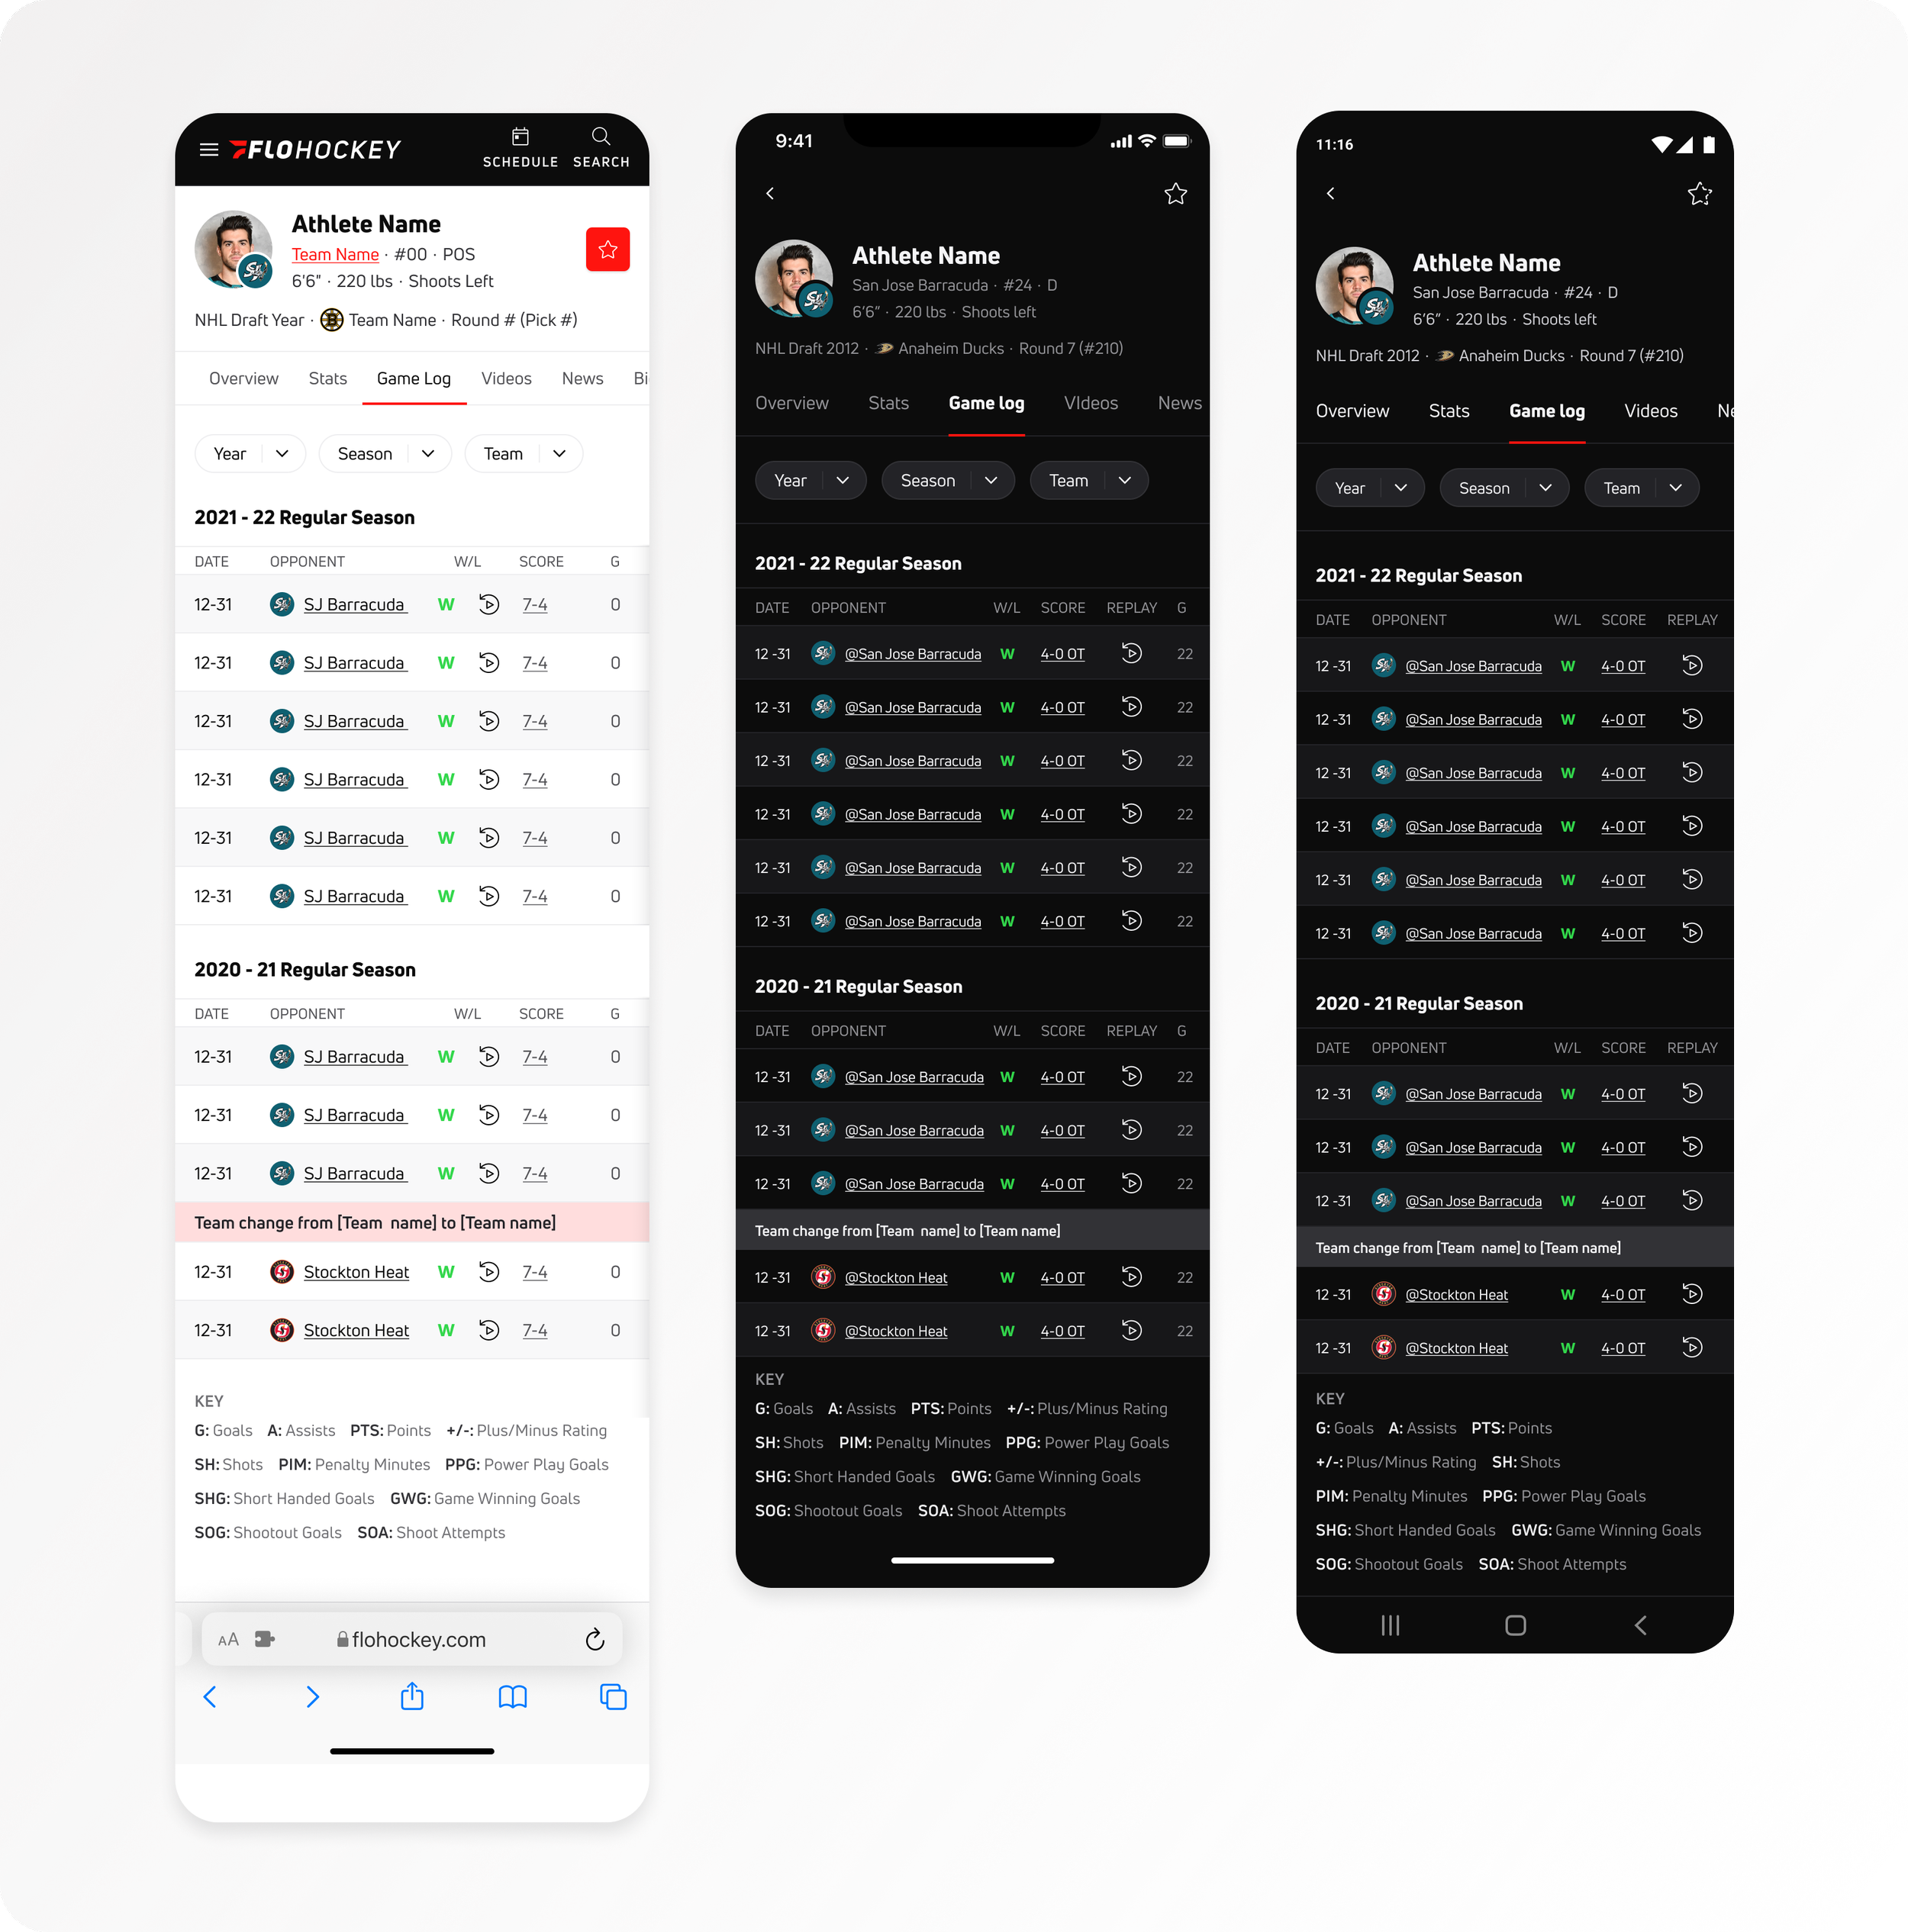
Game Log tab for mobile web — iOS — Android, showcasing team transfer example
team transfers dilemma
One problem we came across through this design process is how to denote when an athlete changed or transfers teams. It was unclear in the initial data set, as we don’t display the athlete’s team, only the team they competed against.
To solve this, we created a distinct row for the athlete’s team given the frequency and anticipated confusion of team transfers. This will allowed the user to quickly understand when a transfer occurred, as this row visually interrupts the data set. This was essential as many team transfers occur mid-season, and that information needs to be relayed.
Filter interaction
Below is an example of filter behavior for an athlete’s game log year filter. This utilizes previously existing native components and interactive patterns with no changes to filter functionality.
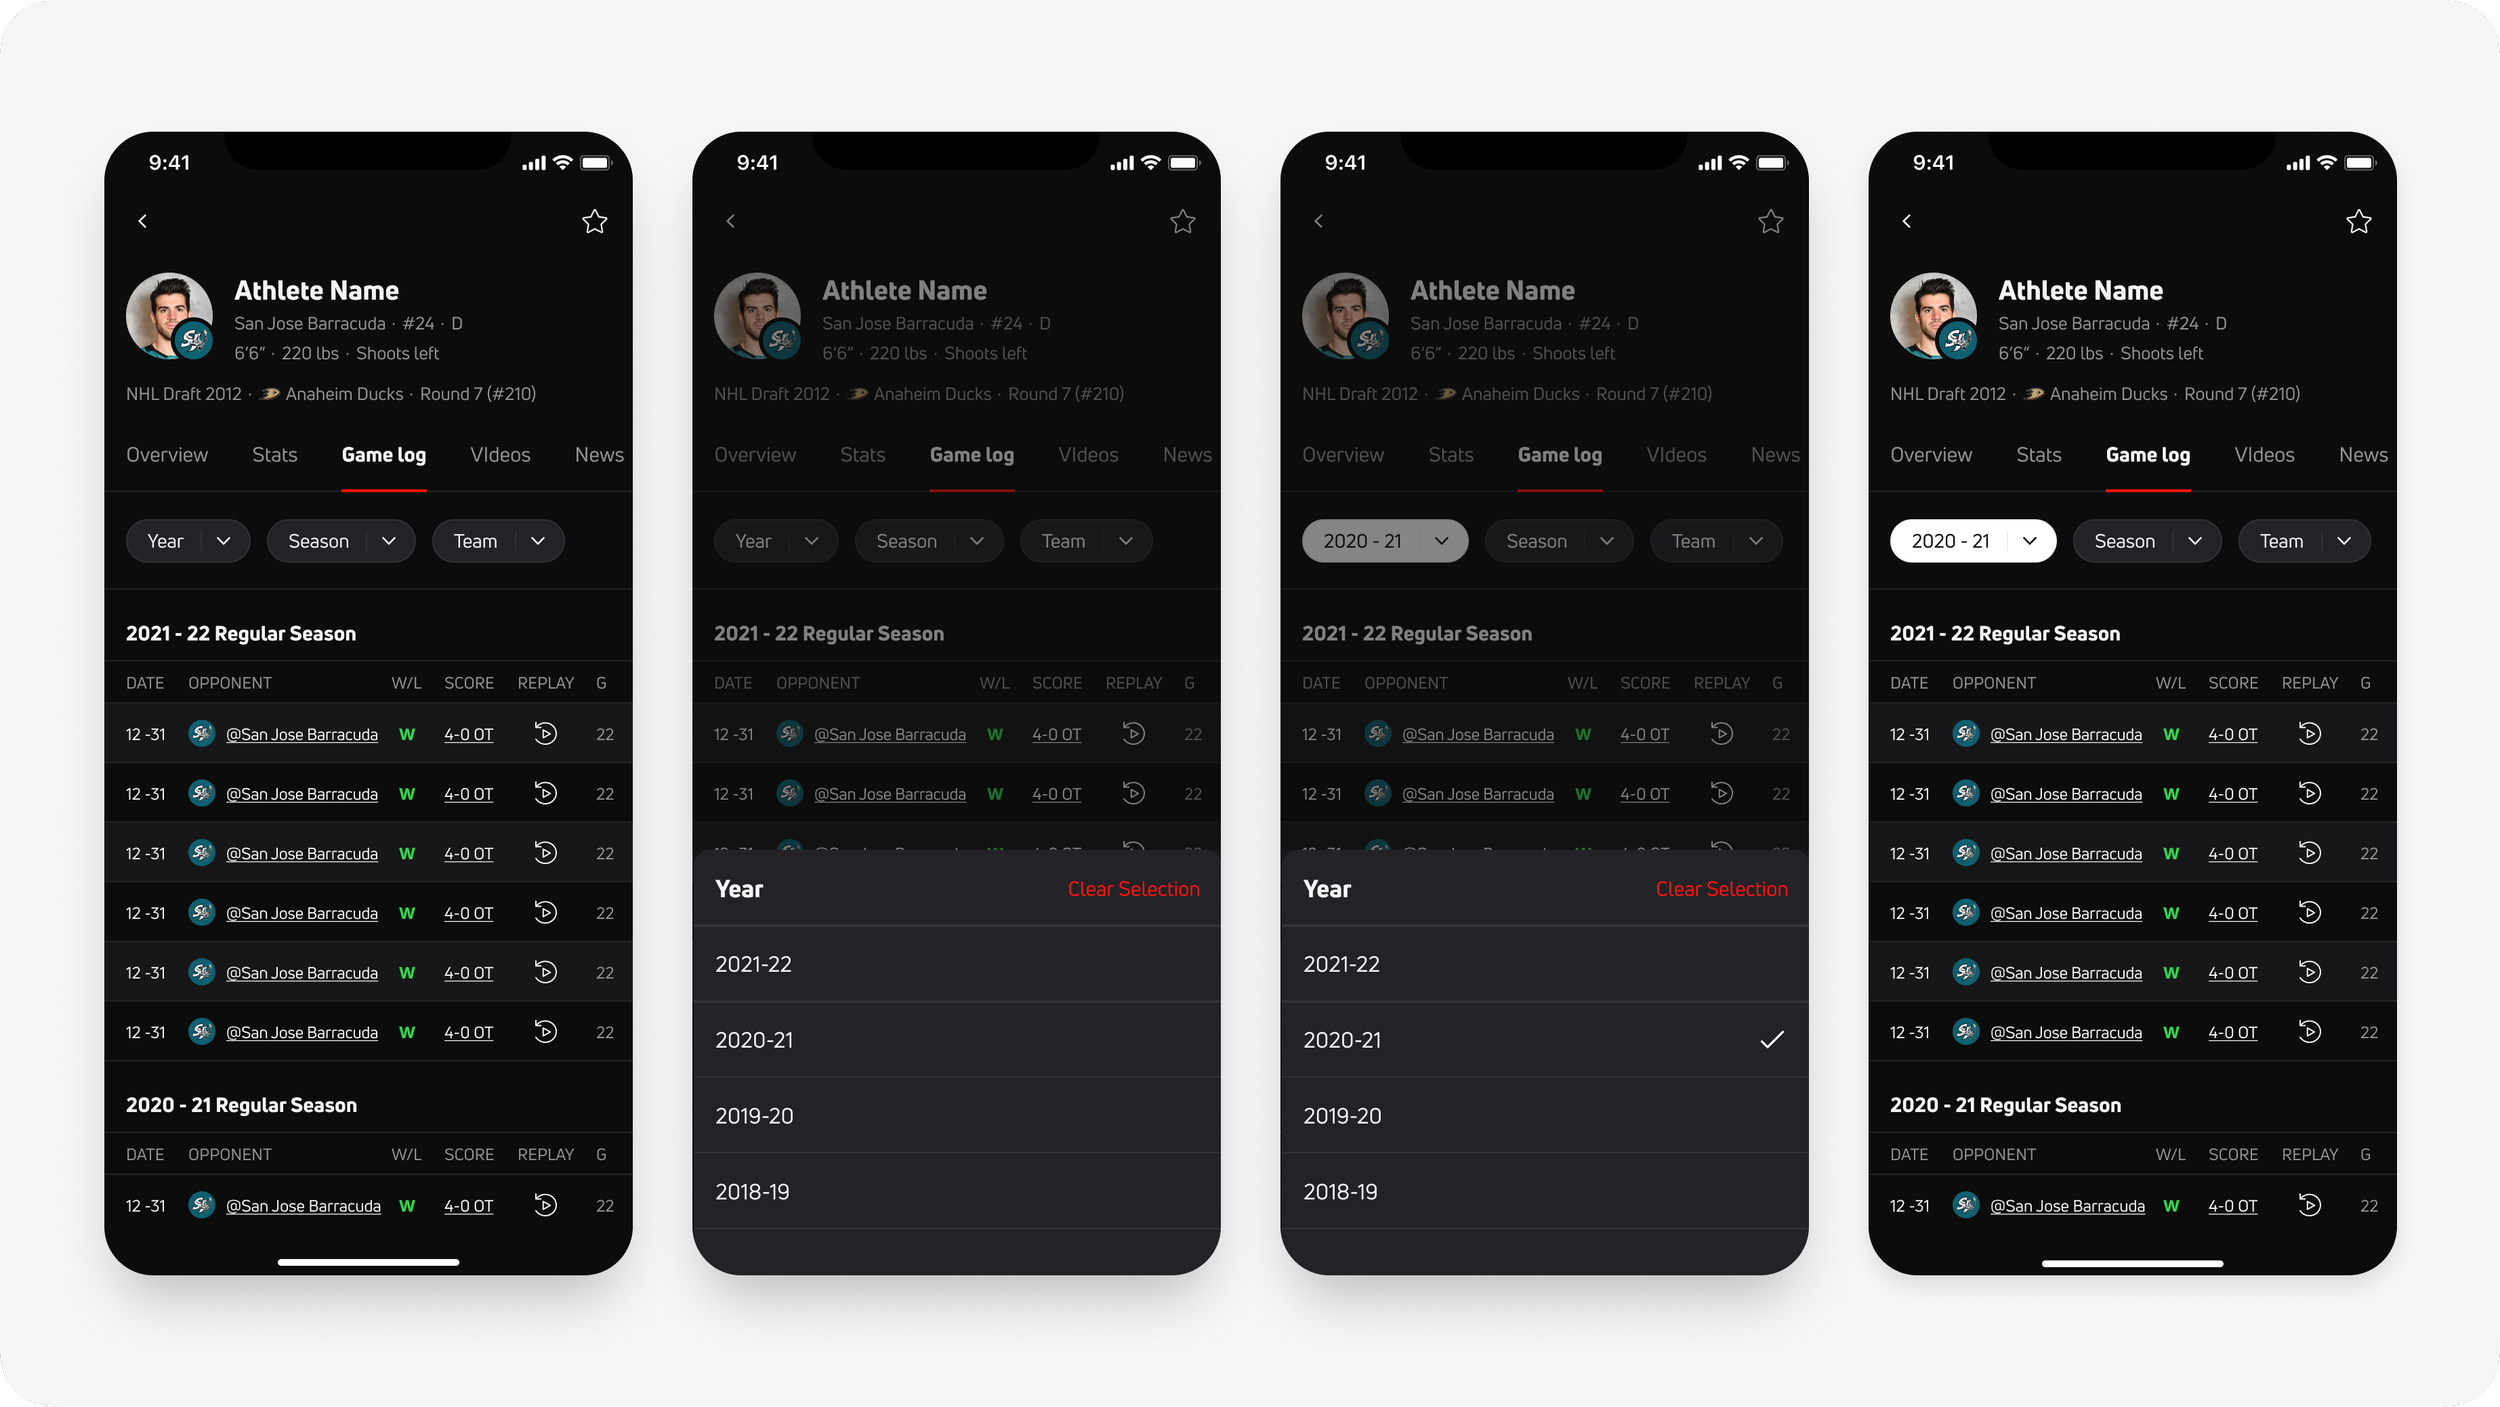
Only one list item is selectable for each filter (for both Game Log and Stats filters). Upon selection of a list item, the menu auto-collapses, and the selected data set is returned. The above interaction can be viewed with this flow of the figma prototype.
Media & bio tabs
The media tabs (news and video) reuse existing web and native components. Both of these tabs display their respective media content such as athlete, team, or league-specific content, depending on coverage availability.
The player bio tab features text-based biography and information (birthplace, birthdate, height, weight, etc.) for historical reference on the athlete’s background.
The iOS designs are shown below, but as mentioned, these designs were created across all platforms as well.
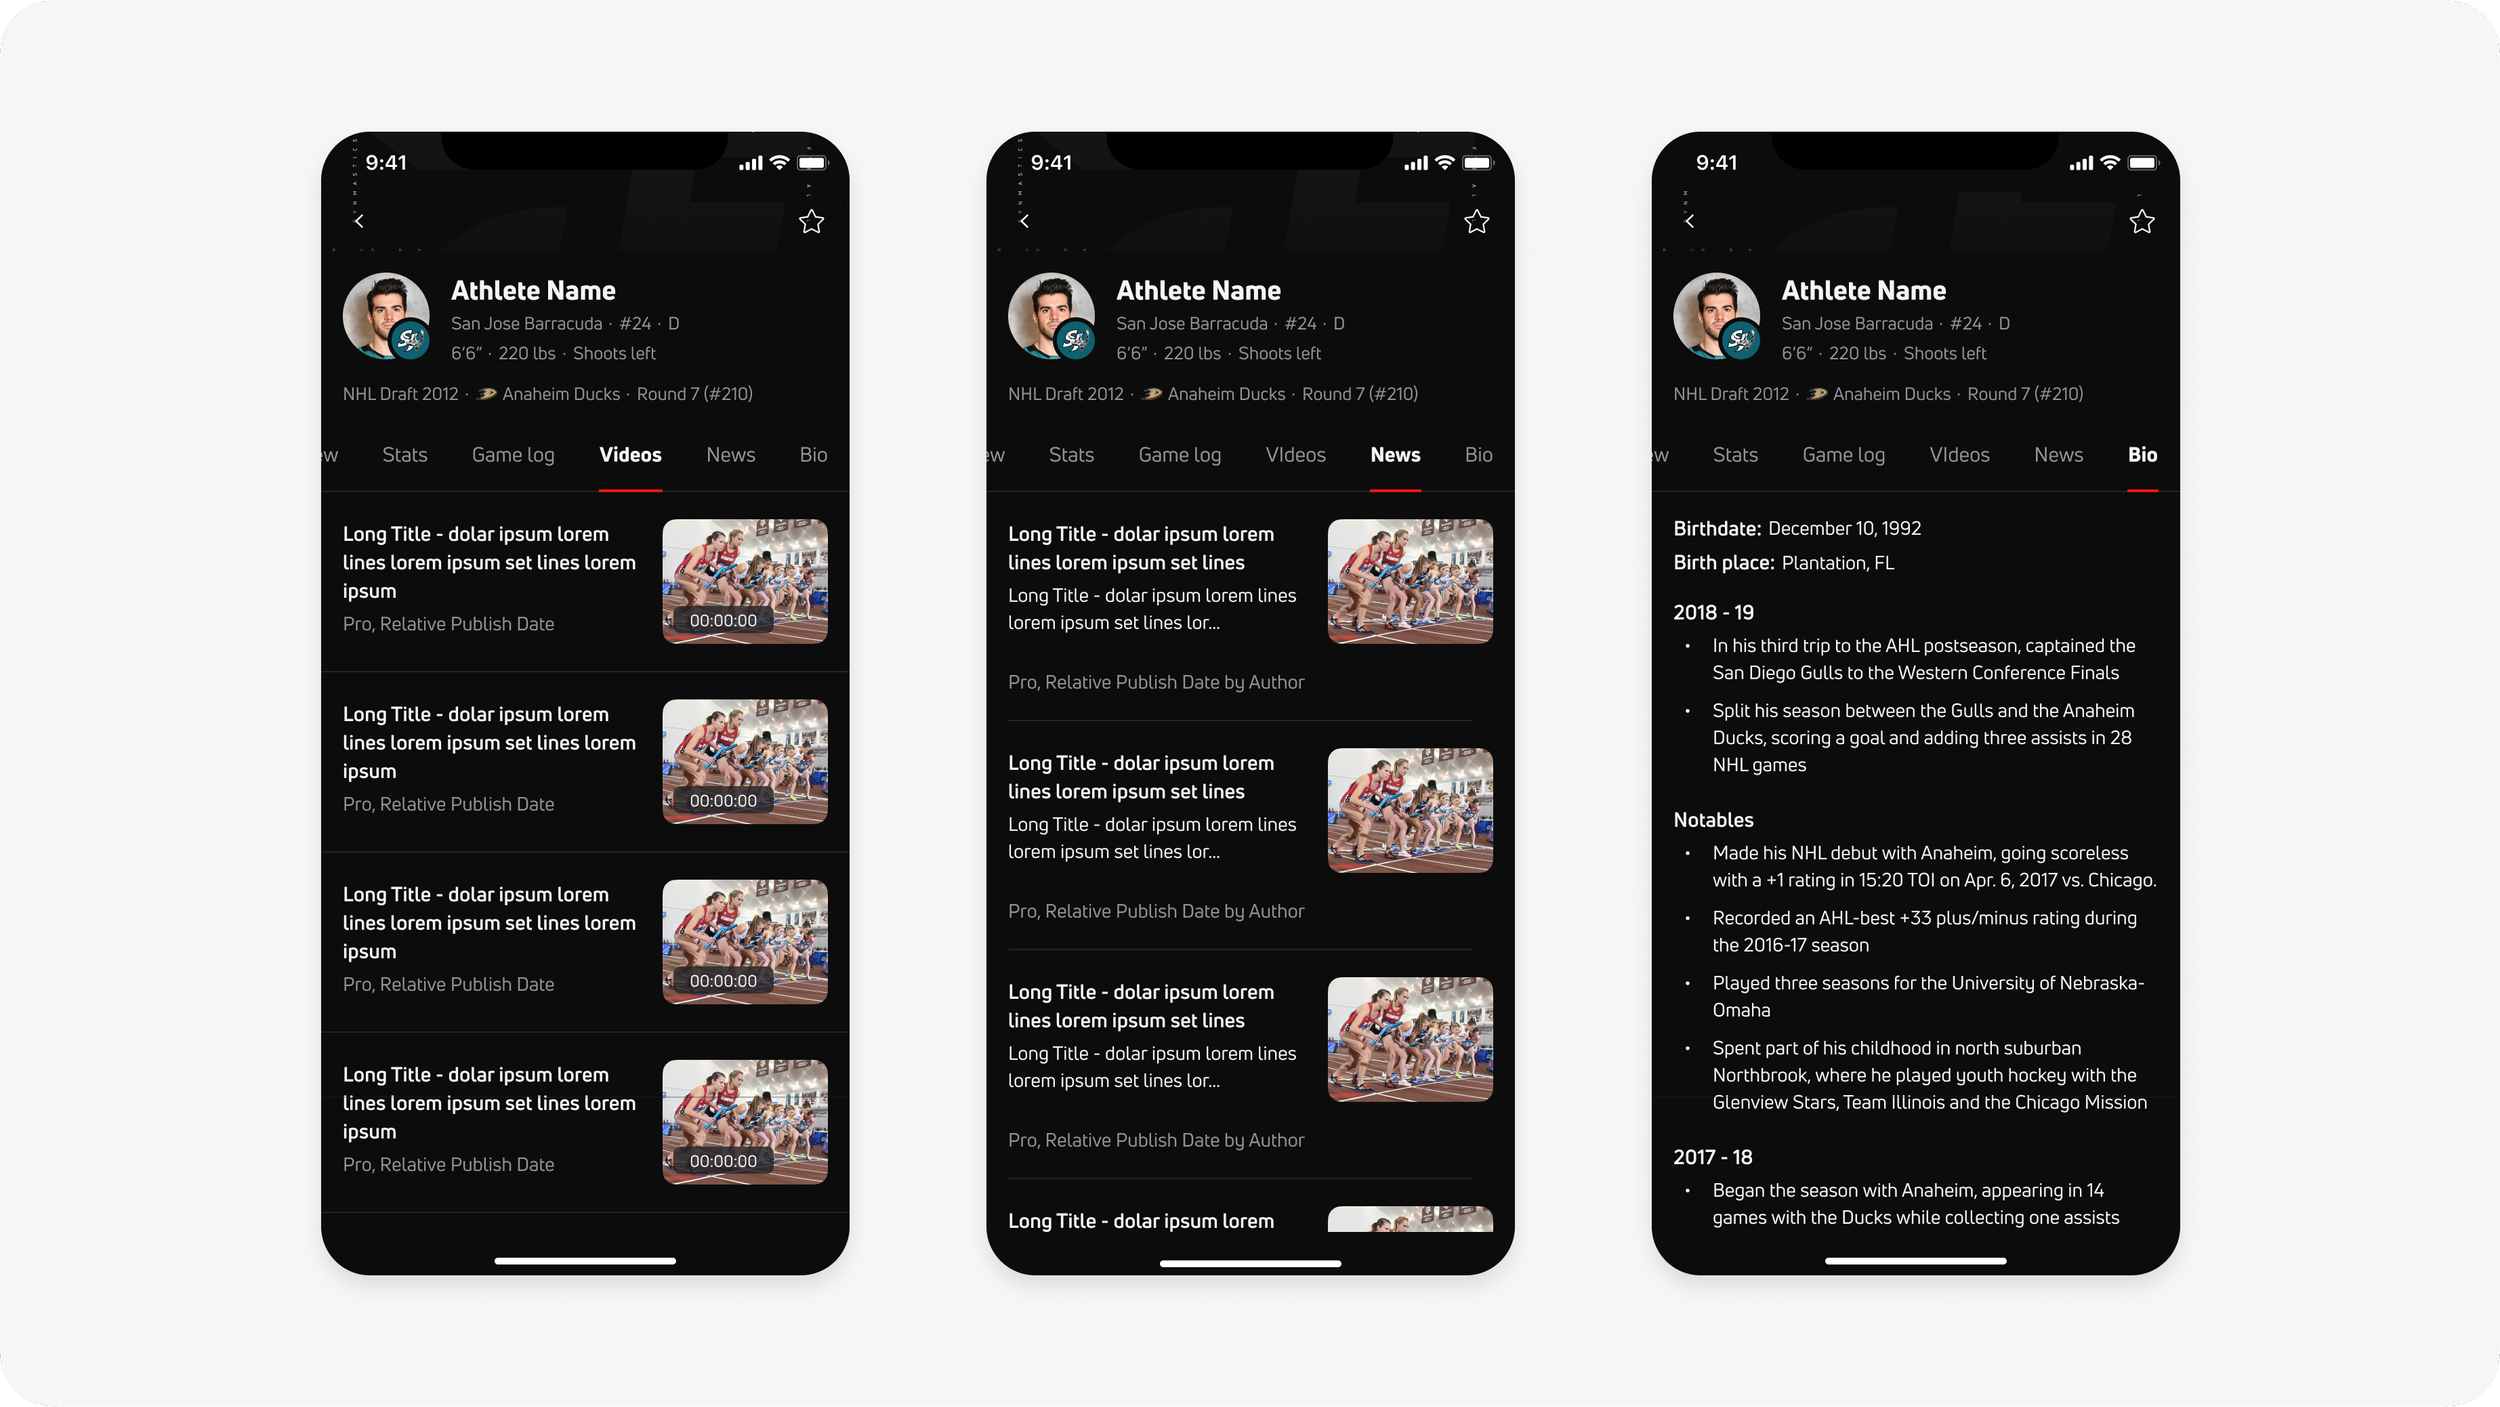
Videos — News — Bio tab on iOS
Responsive web breakpoints
The focus of this project post has been primarily focused on mobile web and native app designs, as these viewports are the cornerstone of our product experience and conversion funnel. All of the designs shown were designed for web as well, considering 5 responsive web breakpoints, across small mobile, tablet, and large desktop screens. An overview for some of these pages is shown below.
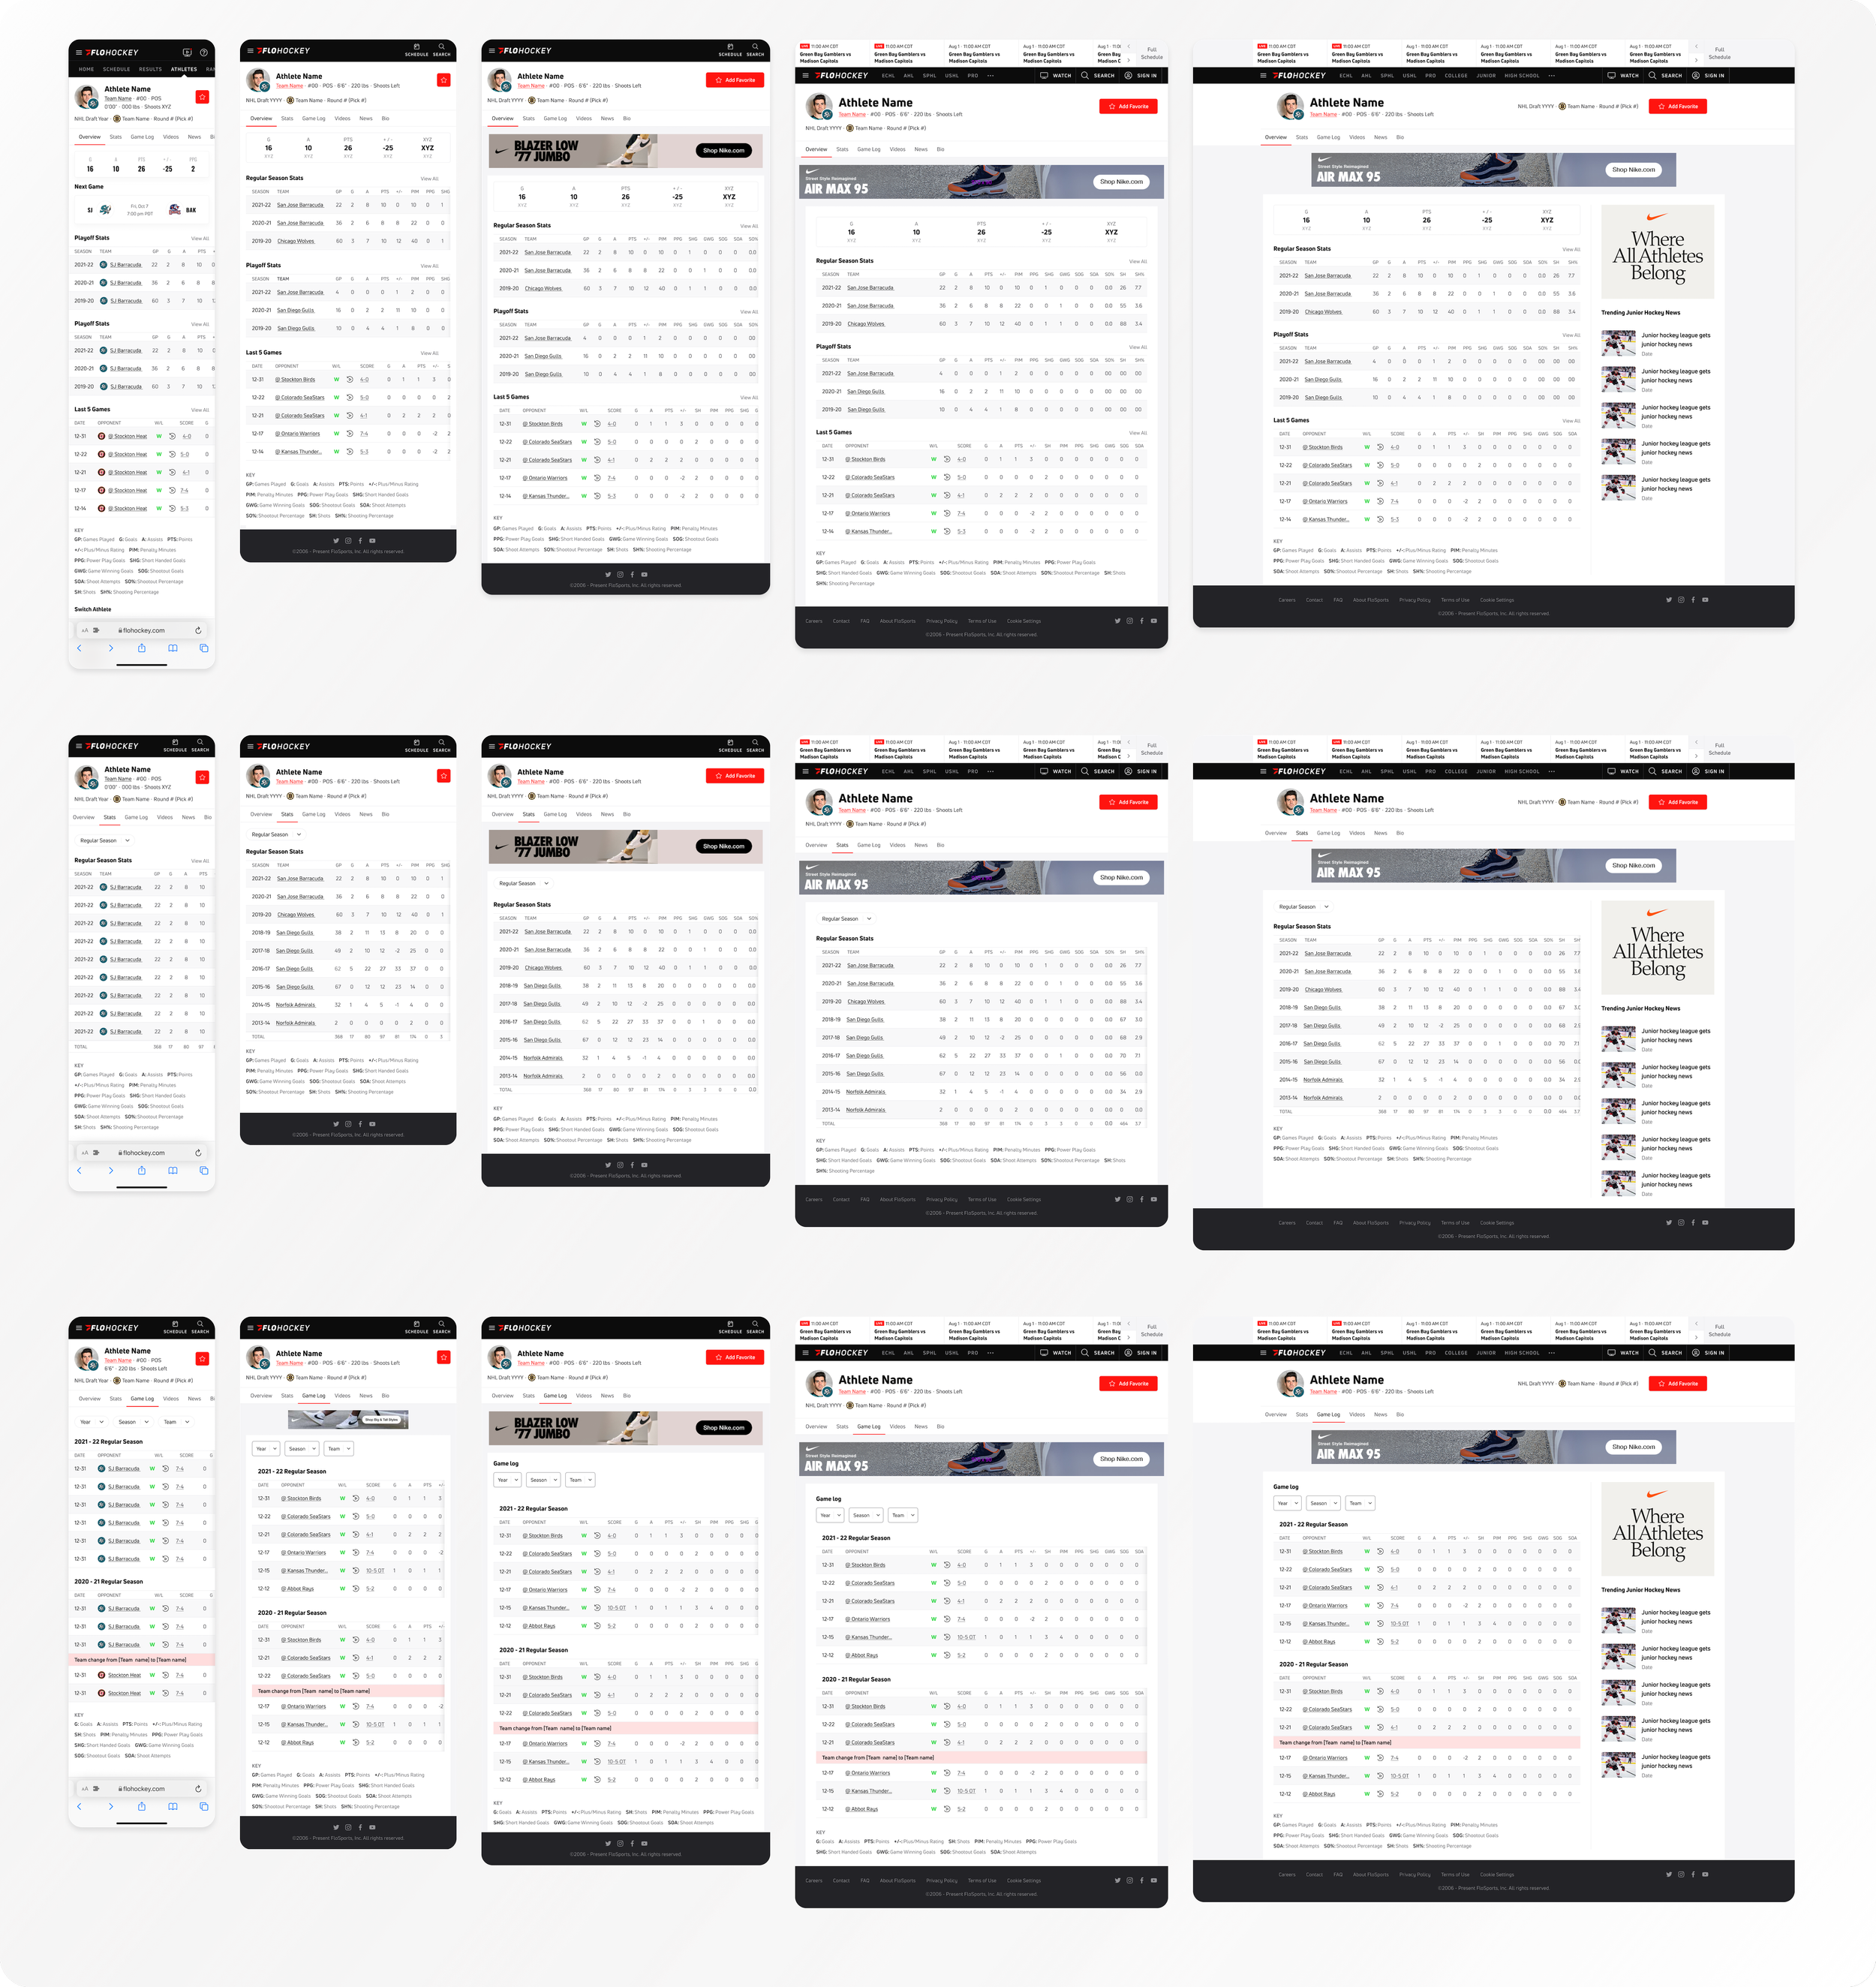
responsive web breakpoints for Overview, Stats, and Game Log tabs
outcome
Athlete Profiles are currently in development, being built alongside their overarching entity collection templates — release planned for September 2023.