
flosports - scores
This project will focus on the design and creation of the Scores experience for FloSports, specifically in the context of one of our top versus sports, FloHockey.
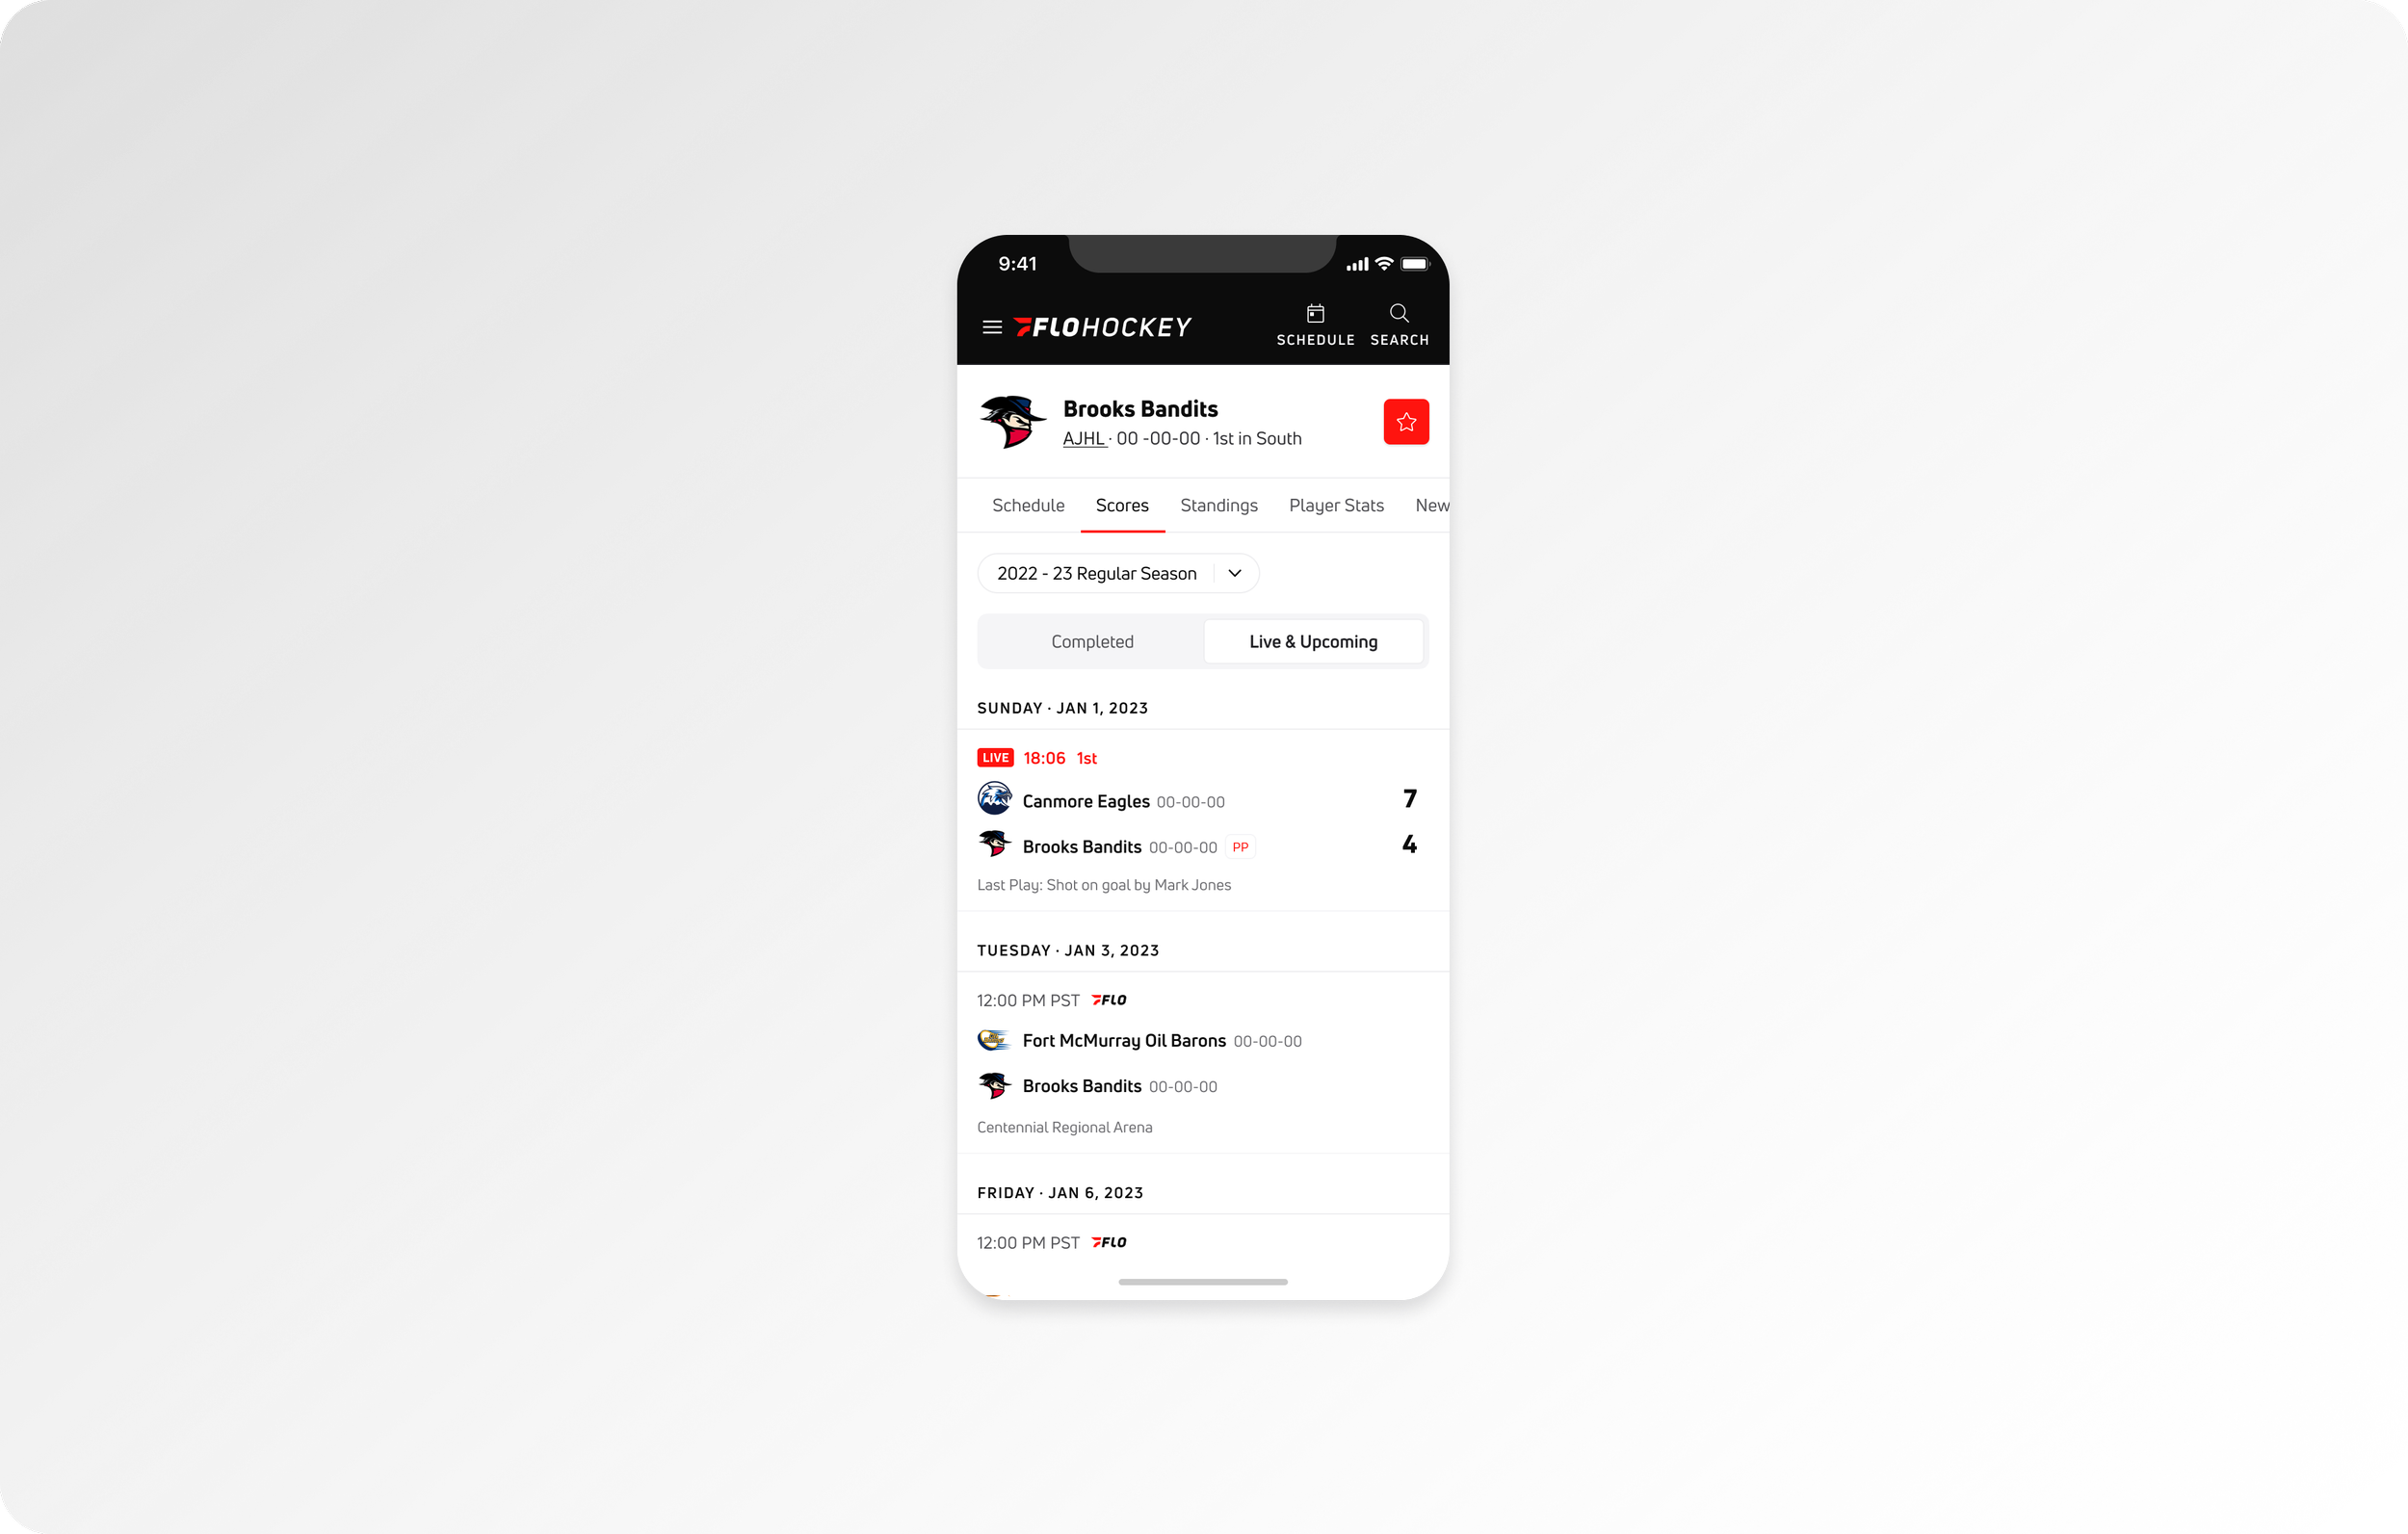
Below is an interactive Figma prototype introducing the Scores component variants as well as the direct prototype link. This example is for the mobile web breakpoint of a team page showcasing the [Live & Upcoming] and [Completed] game tabs.
background
Scores are an integral part of any competitive sport. But at the end of the game, fans don’t just care about who won and who lost. The data, the players, the journey of the game are just as vital as the end result. The design of the Scores experience provides the further telling of this story. Using hockey as the initial framework, these pages serve to develop our next-gen fan experience for all upcoming versus sports.
Although FloSports covers many team-based versus sports, these Scores designs were the first data-rich experience of its kind within the product sphere. The acquisition of HockeyTech in 2022 paved the way for investment into this essential feature.
Similar to the athlete profiles project, this scores experience lives within the architecture of a league or team entity collection. For additional context on these page structures, the entity collection IA project takes a closer look at these established patterns.
I designed this experience for FloSports iOS, Android and responsive web products.
goals
The main goal of the Scores pages and its subsequent components was to provide users live feedback and score results for their sport. Not only to provide the minimum results data, but to provide the next-gen data rich product experience through real-time event scoring updates during a streamed event. Essentially, to immerse and engage the fan through scoring and results data. The acquisition of LeagueStat (HockeyTech’s live data and scoring service) allowed our team to fully explore that within the context of Hockey.
The other major goal of this project was scalability. We’re designing this within the sport of hockey, but the goal was to create reusable and interchangeable components/layouts to be utilized across all our versus-scored sports.
Layout & header
These score pages reside within the new entity page navigation, featured as an individual tab within the team and league collection pages. Within this tab, the user has the option to navigate between present and past games using a season filter.
Within a specific season, the user can further navigate to view results from a specific game. This interaction differs slightly for team or league scores.
A team’s score page presents a toggle navigation between ‘Completed’ and ‘Live & Upcoming’ scores for that specific team. A league’s score page displays a calendar picker for all the team scores within that league. The navigation patterns are differentiated here due to the greater volume of games for a league vs. a team — i.e it’s much easier for a user to navigate a month/day calendar scroller for a league since a major league can typically house hundreds of games per month.
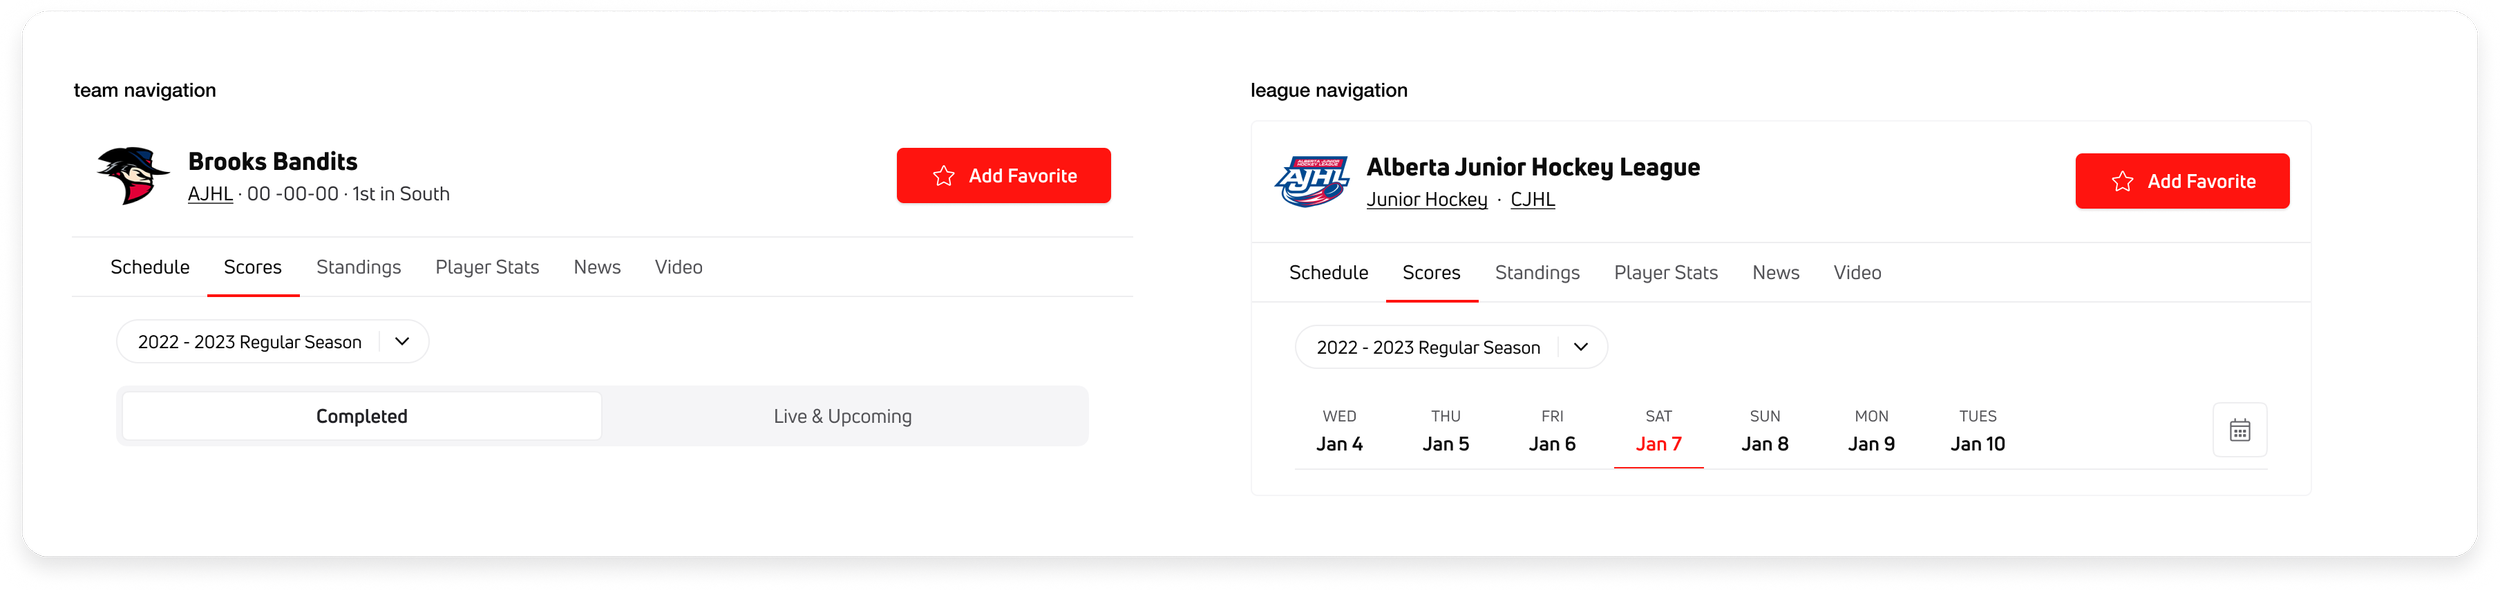
team (left) and league (right) header navigation — example shown for web component
Scores Component IA (global)
Within the scores component, various design elements are used to prioritize data. Negative space, color, and varying font sizes and weights signify this hierarchy. The exact metadata presented differs depending on the game status and device breakpoint, with each of the items below displayed in some form. The following items are ordered from highest to lowest priority, reflected in the component UI
Score (final and live)
Team logos
Team names
Game time/status (live data, upcoming time, completed/final status)
Streaming badge (only shown if the event is streamed on FloHockey)
Period table scoring (on larger web breakpoints)
CTAs (link to live game, preview or box scores depending on game status on larger web breakpoints)
Team record
Power Play indicator
Win/Loss indicator (for completed games)
Game details / Last Play / Location
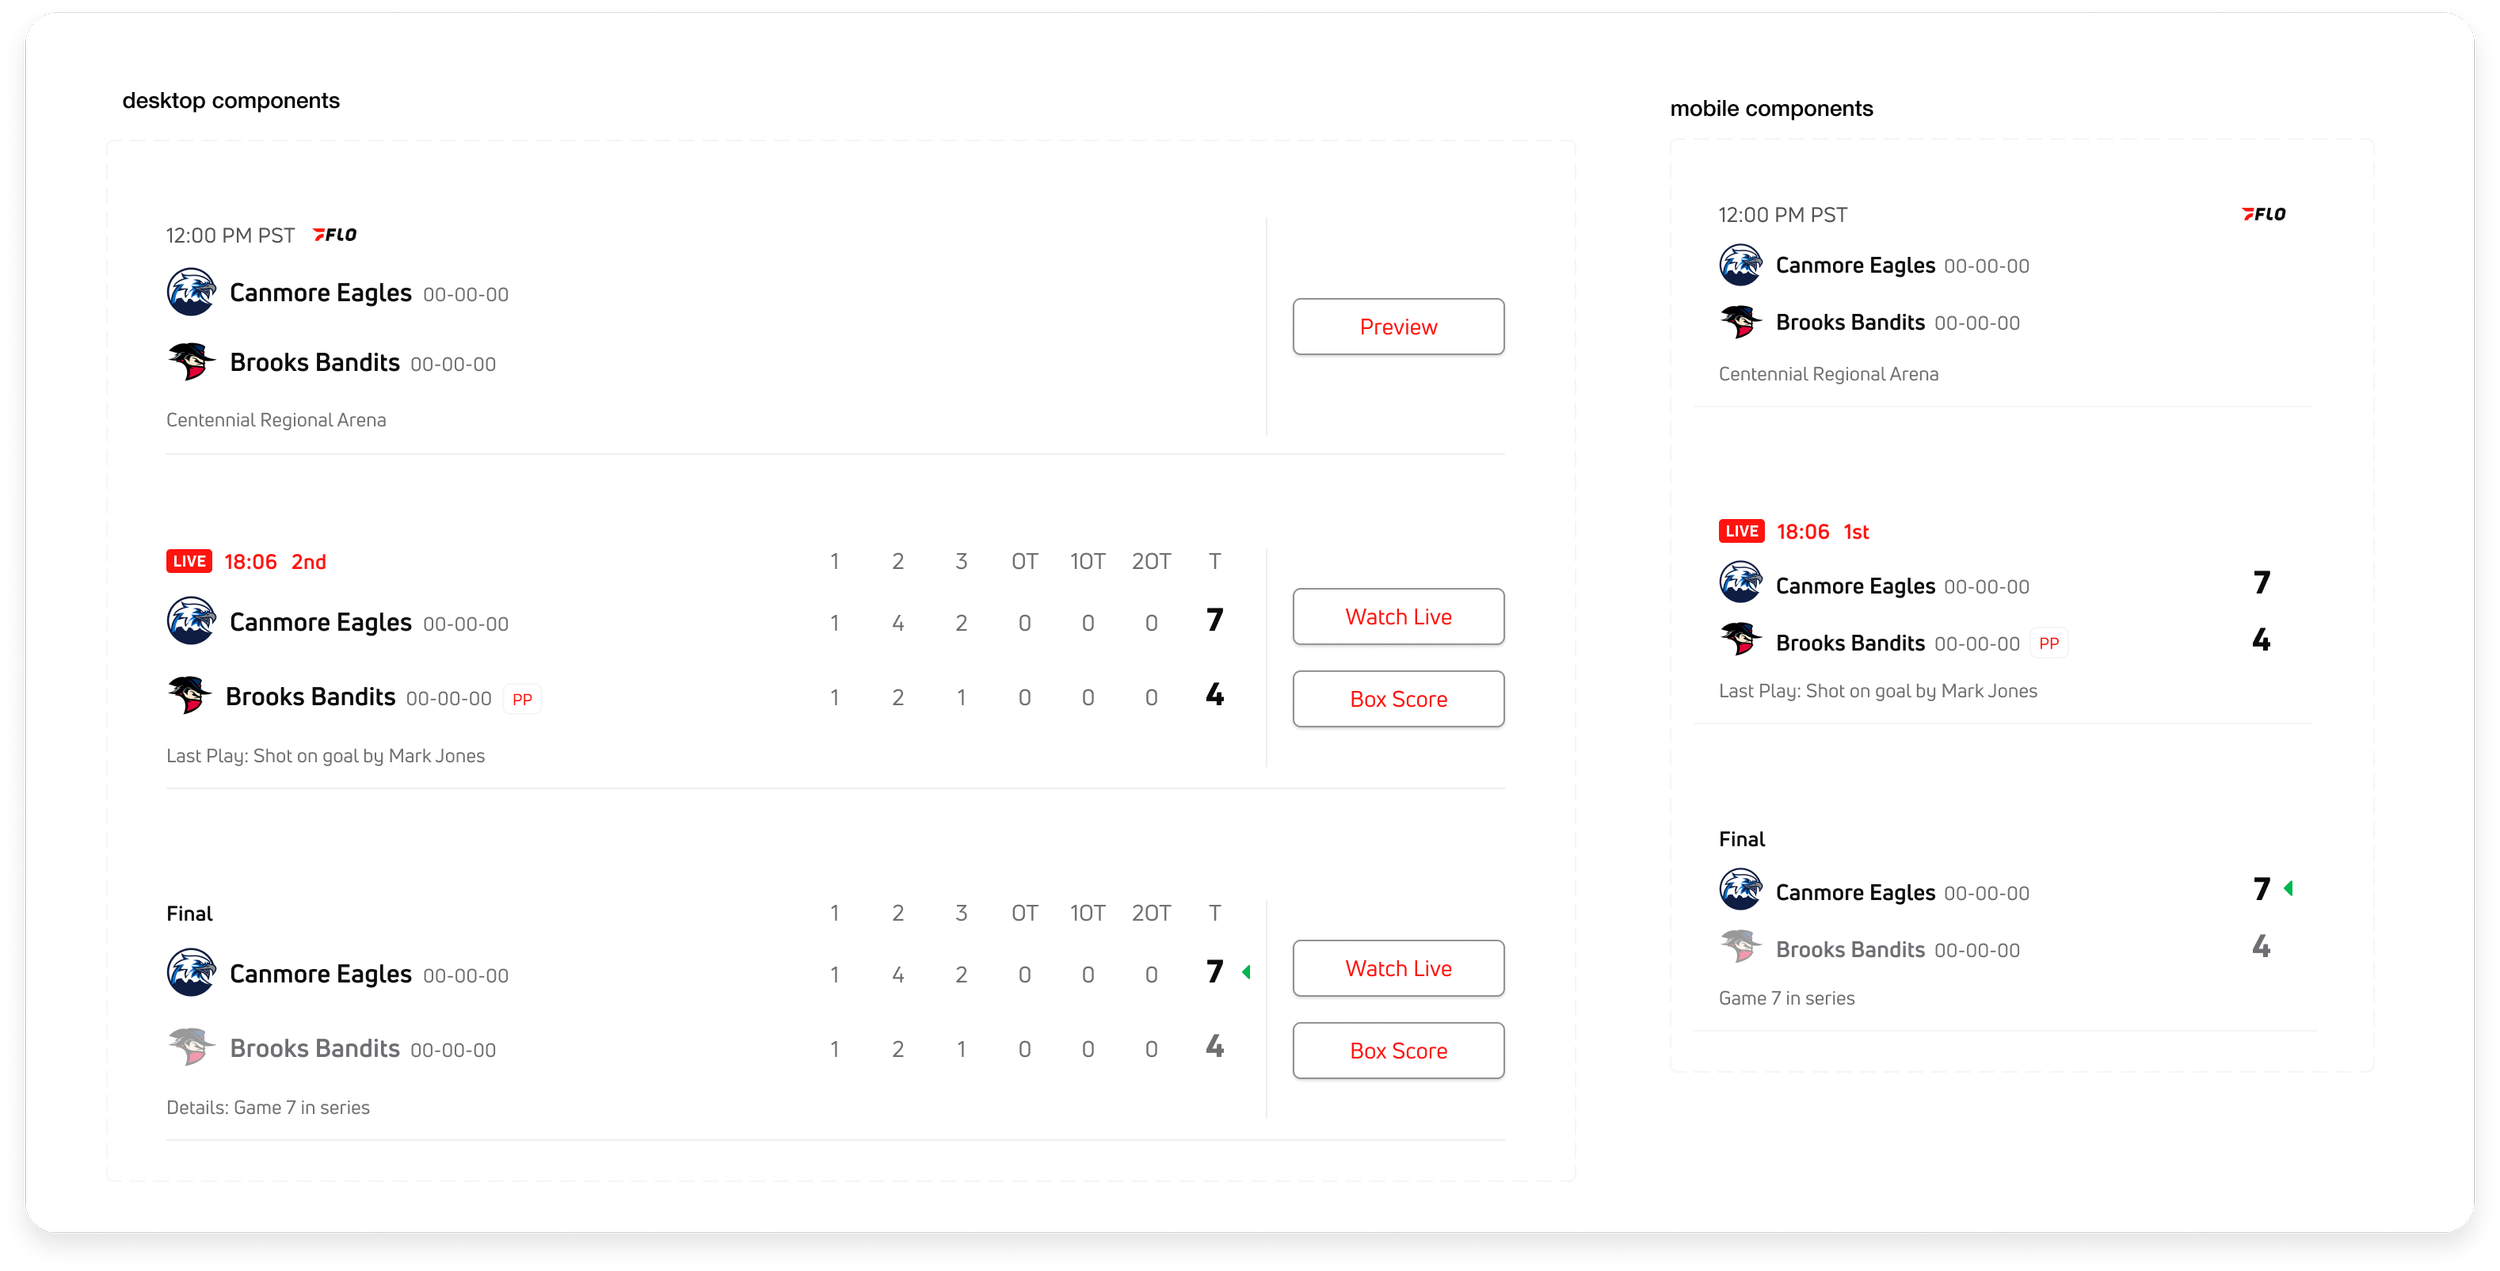
desktop (left) and mobile (right) score components (upcoming, live, & completed states)
Game status
As shown in the image above, there are three event statuses to keep in mind for this component - Upcoming, Live, and Completed — this status impacts the displayed metadata.
The component metadata also depend on the user’s device. For the live and completed game status on larger screen sizes, the per-period score table is displayed to provide a richer data-centric experience. The table components also consider overtime scores after the 3rd period, providing additional context into the game.
component variants
Upcoming component variant
The upcoming game component is the most simplified of the three states. It displays the game start time and the streaming info above the teams.
The ‘Preview’ CTA redirects the user to the game details page on the desktop breakpoints. On mobile, selecting the entire cell redirects the user to that same page.
Location/arena info is shown below the teams.
Live component variant
The live game component begins by displaying the live badge, game time, and period in red above the teams.
The live (and completed) score is the largest element within this component. On mobile, the score is displayed inline the corresponding team. On larger breakpoints, the period and overtime table is displayed beside the live score.
Adjacent to the team record, we display the Power Play “PP” badge when applicable. On the larger breakpoints, the CTAs redirect the user to the live game or the box score. On mobile, tapping the entire cell redirects the user to the live game player.
Additional live game details are displayed below the teams such as the last play or last goal.
Completed component variant
The completed game component displays ‘Final’ indicating its status. Similar to the live game component, the period score table is displayed on larger breakpoints. Since the game is over, an indicator is shown beside the winning team providing quick readability. The losing team logo increases transparency with a lighter team name color indicating a loss.
Other game metadata can be displayed below the team names depending on the event.
web breakpoints
Below are all the responsive breakpoints for the teams and leagues score pages. As the screen size increases (past the XS and S breakpoints), the extra real estate allows for the inclusion of the period table and further game data display.
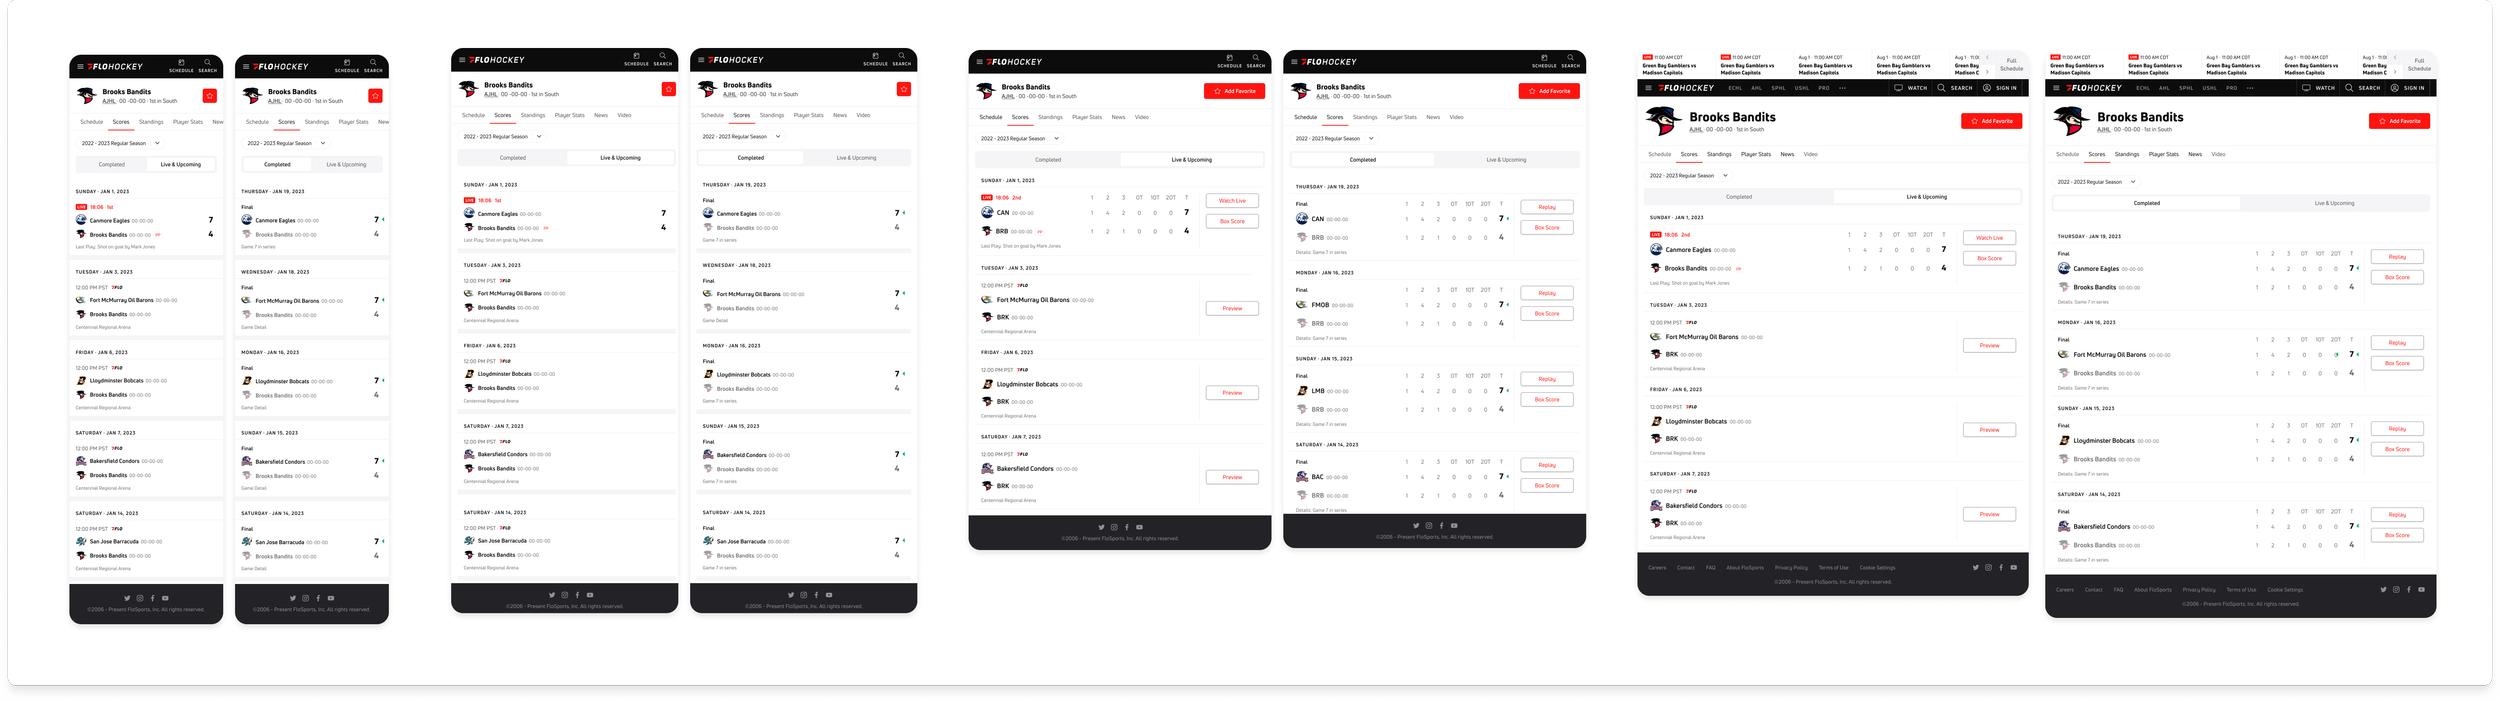
team scores on responsive web — for Completed and Live/Upcoming tabs
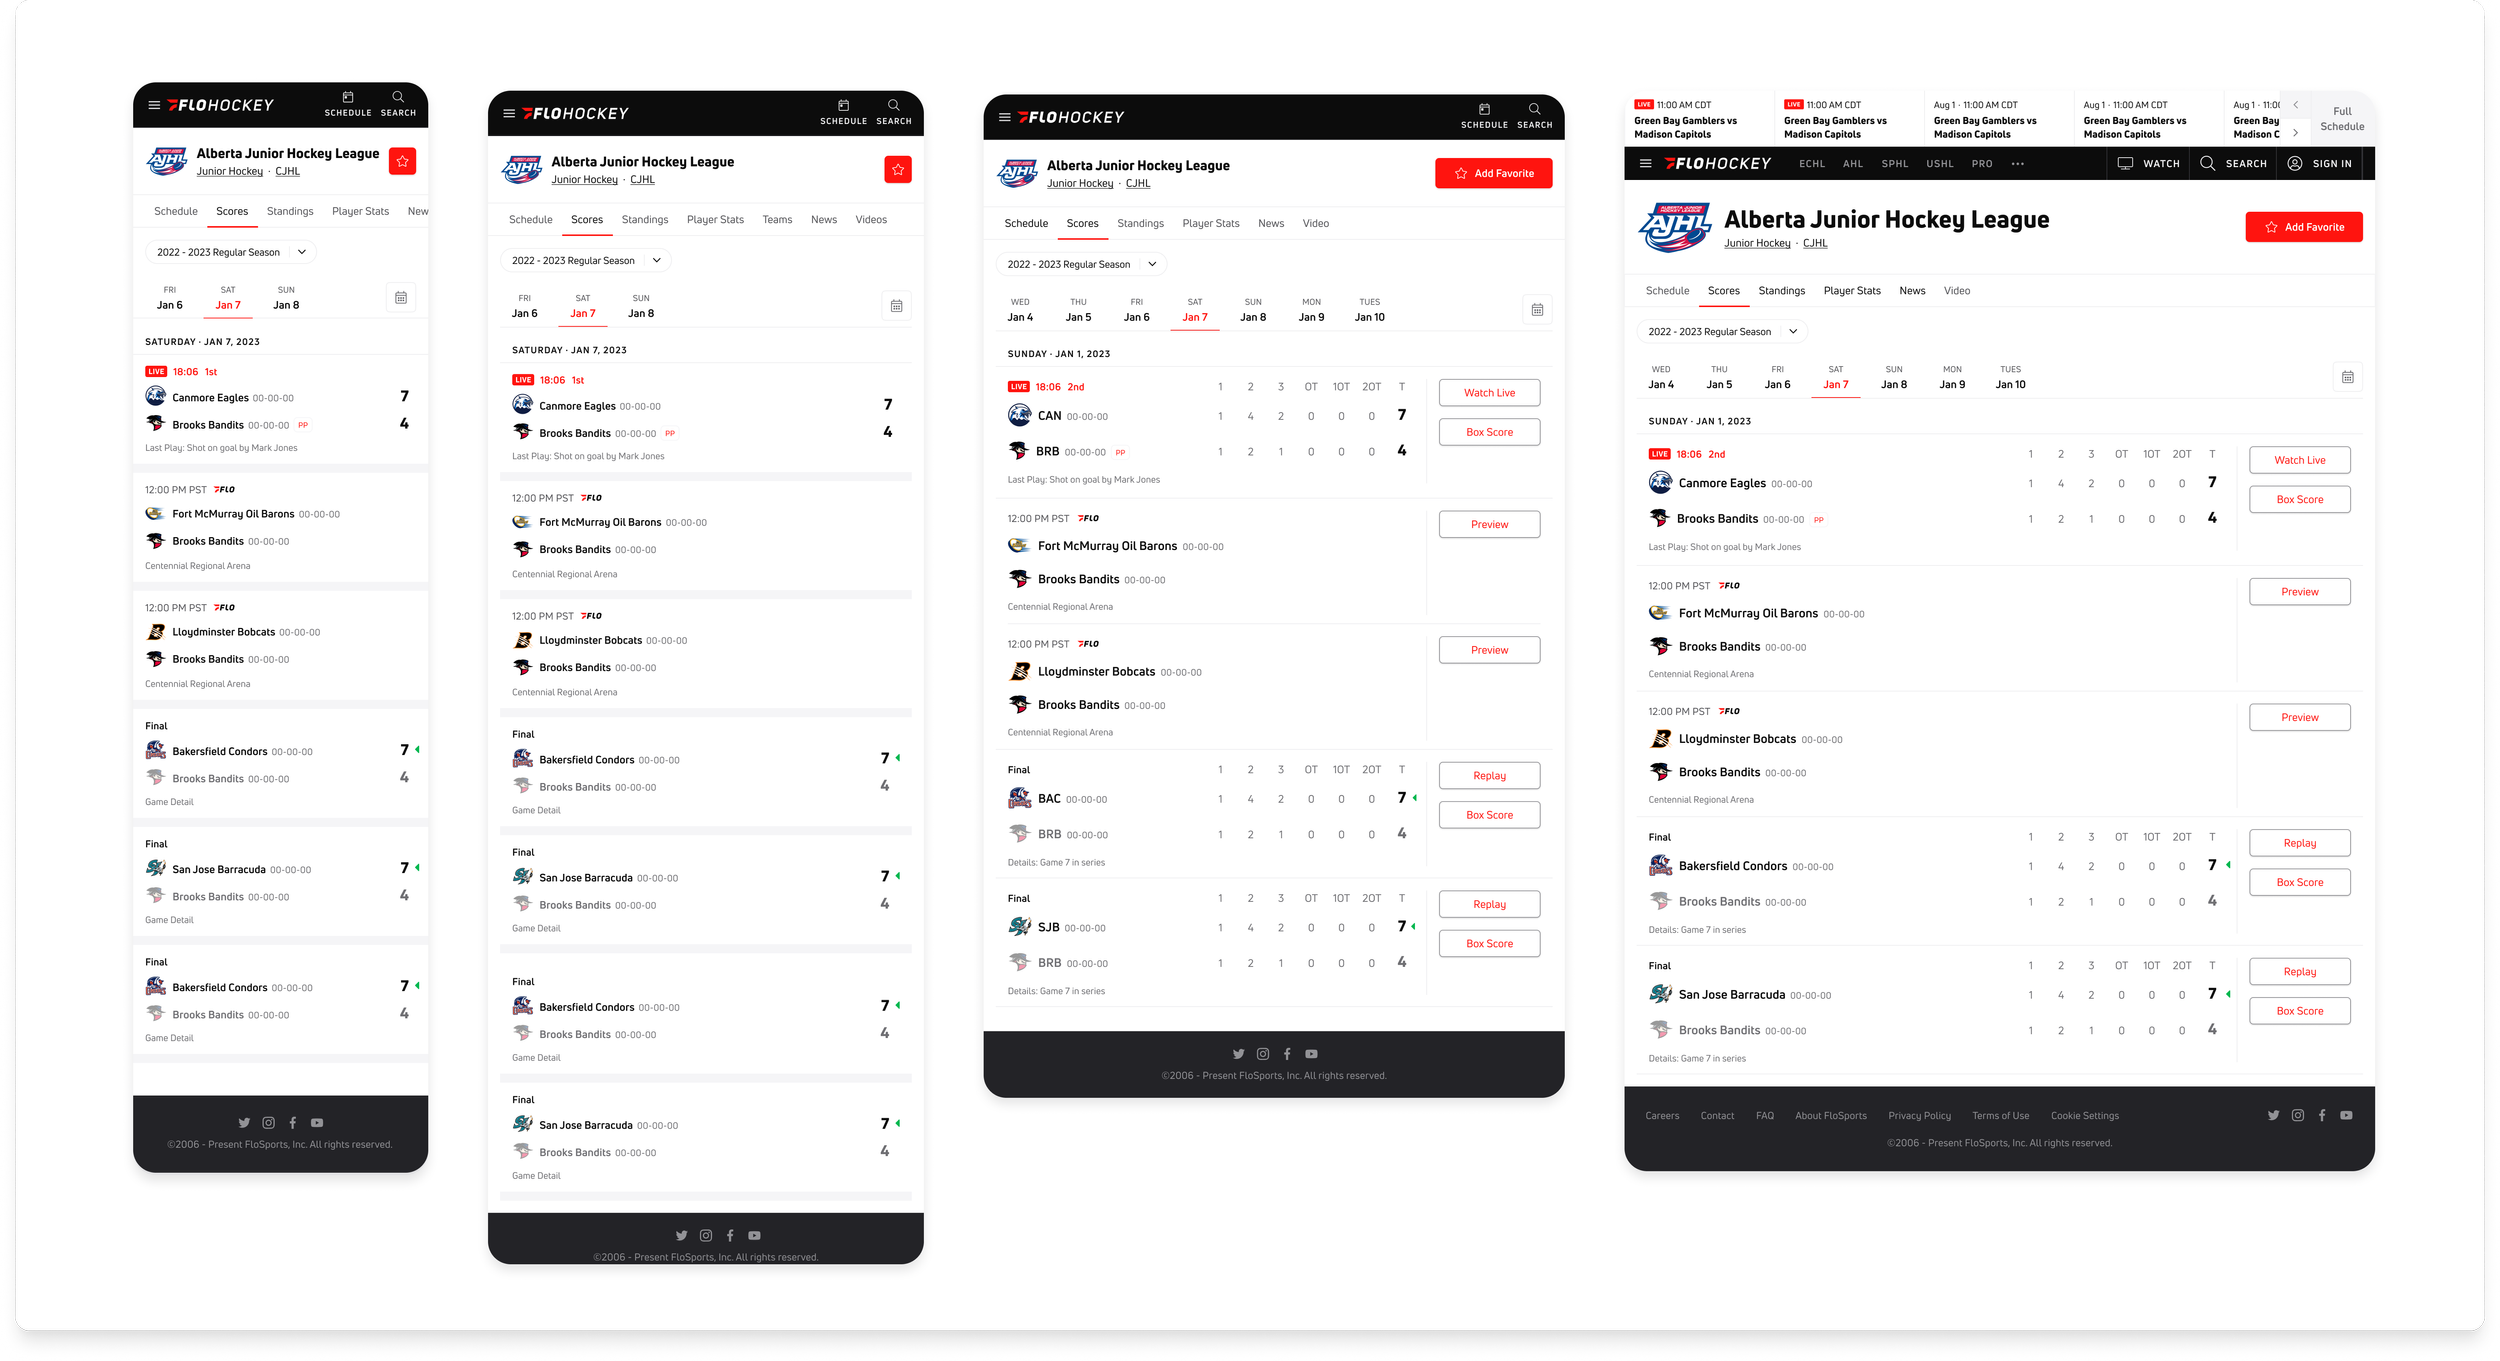
league scores on responsive web
the app experience
Below is an interactive Figma prototype showcasing the iOS Scores designs, in addition to global hockey entity collections architecture. The native discussion below displays iOS examples, although these changes impact both Android and iOS environments.
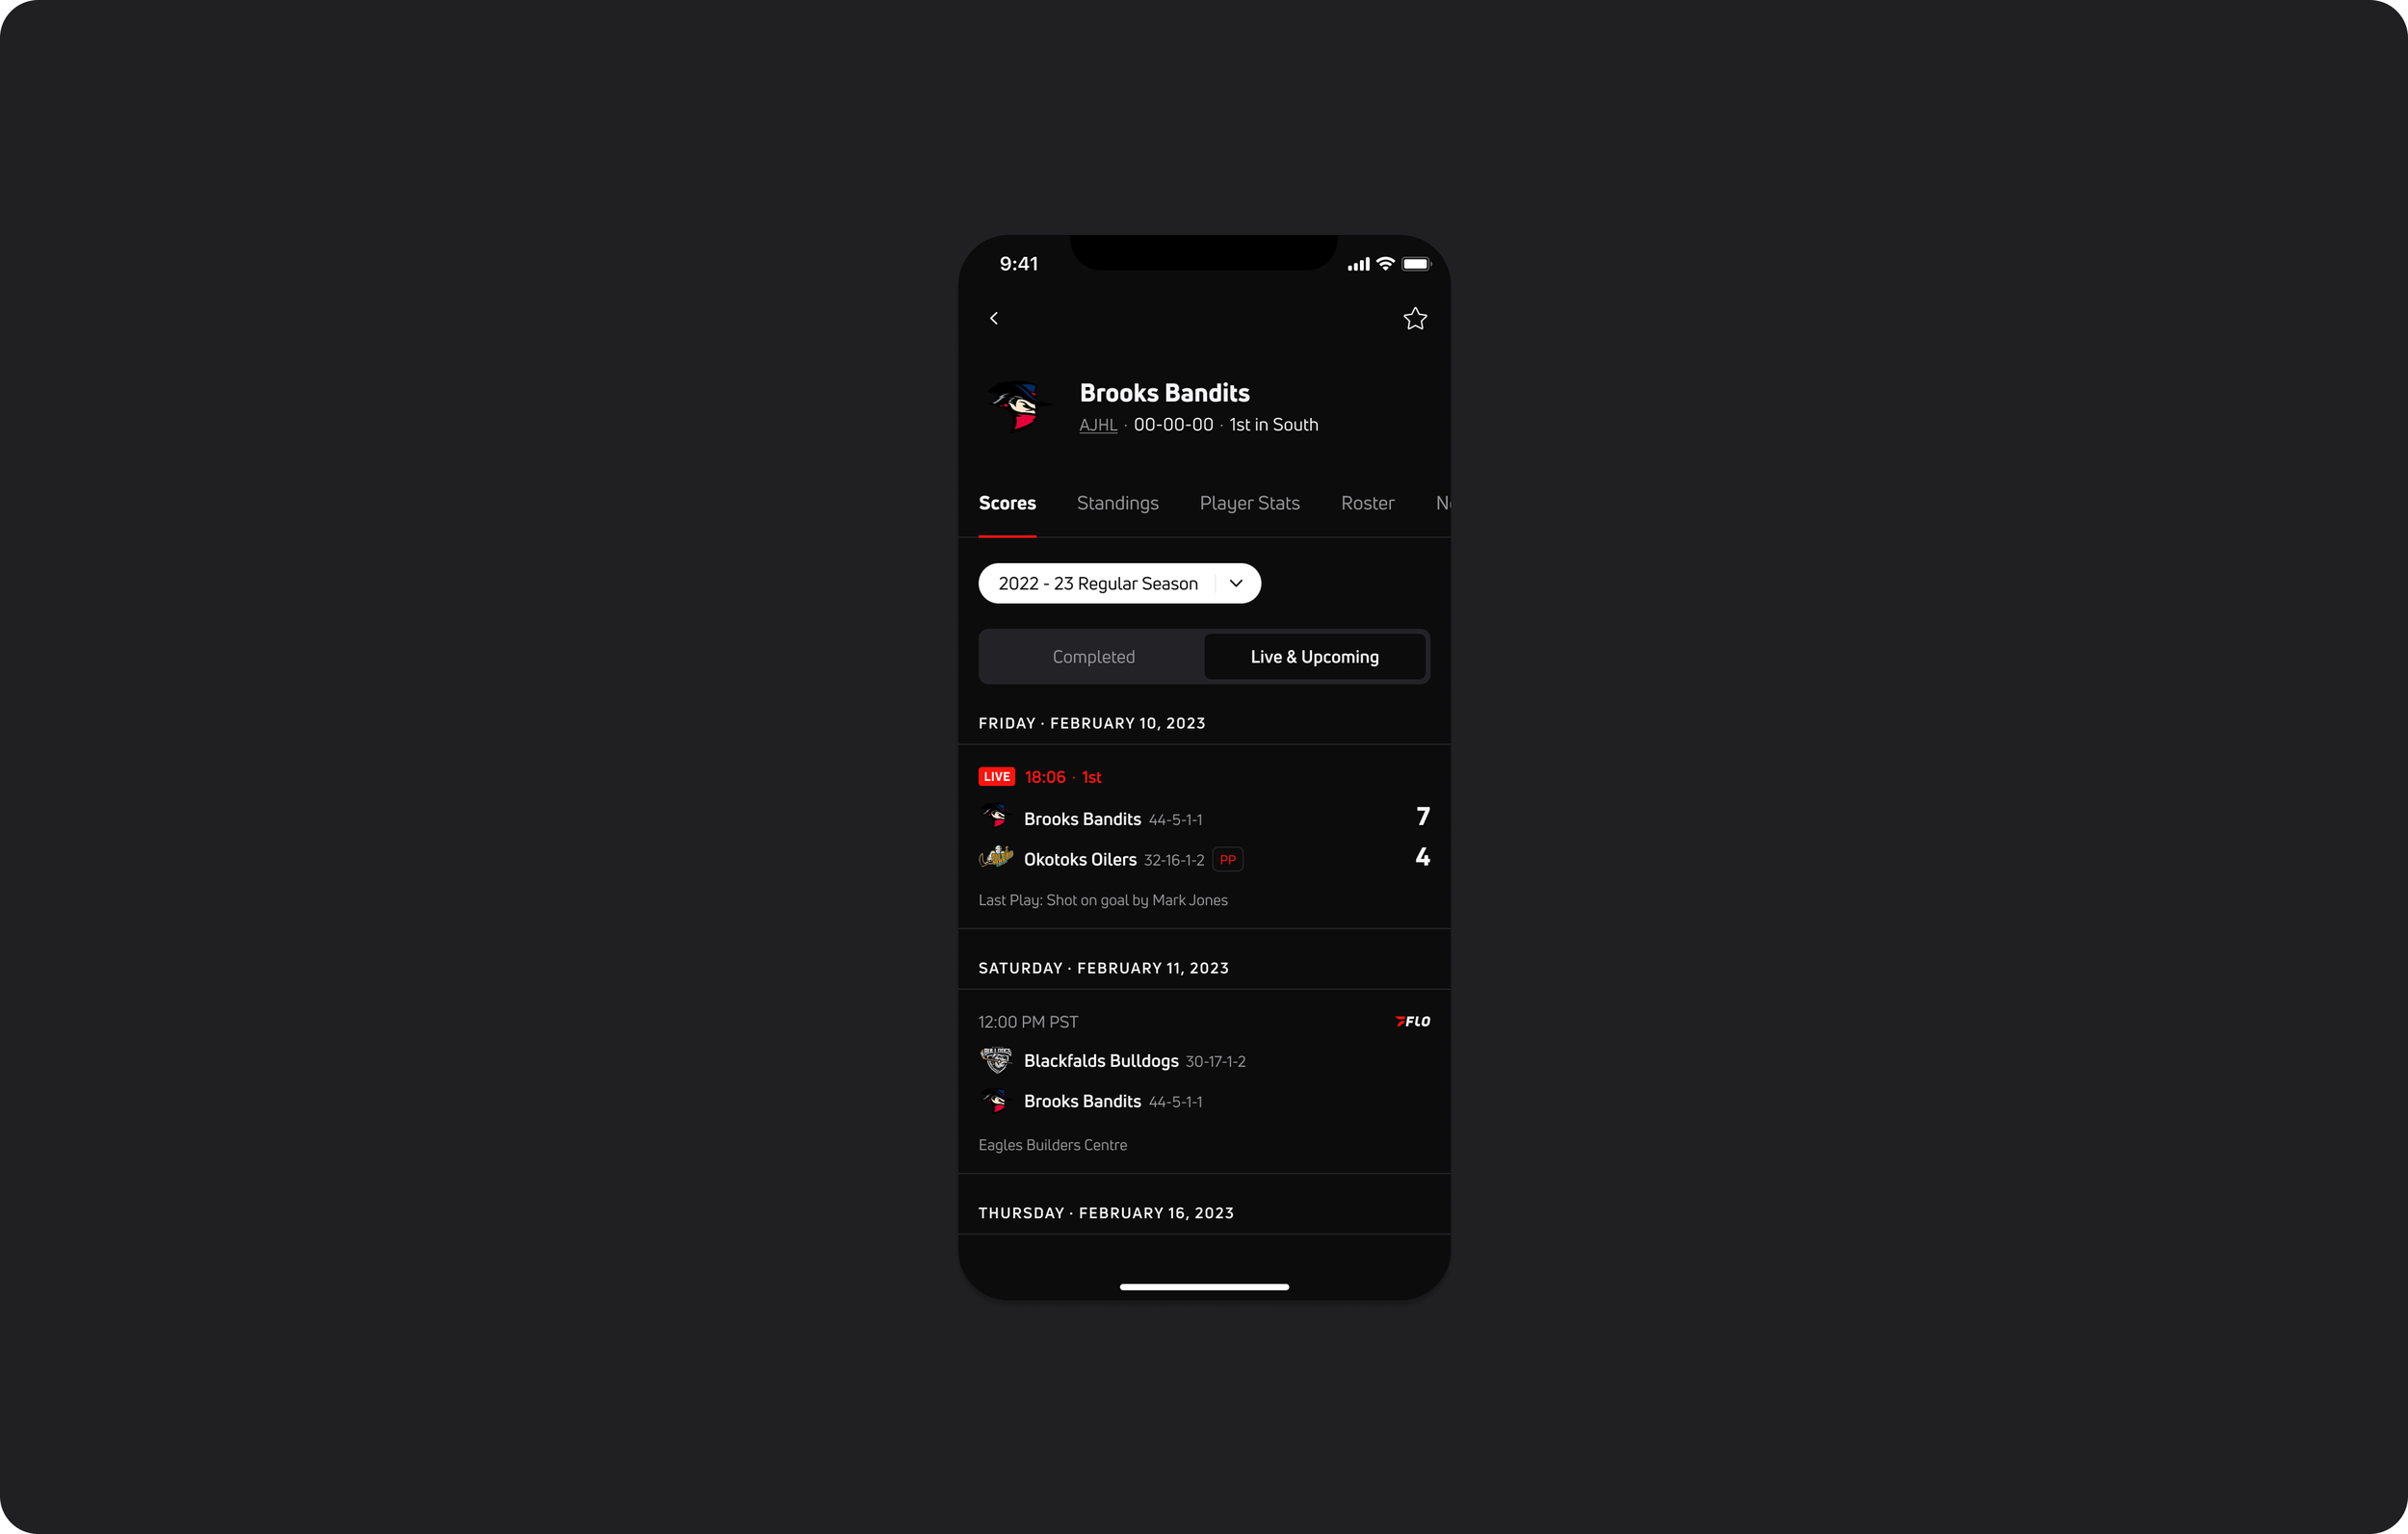
Scores & Schedule combination
There are several architectural differences between the native and web environment. One of these differences is the unification of the scores and schedule pages.
Unlike the web experience, within the native environment, the user navigates within one tab [Scores] to view both score data and scheduled events. Because of this, components without any sport/score data need to be accounted, used to display upcoming scheduled games.
In contrast to the score components, the schedule-only components don’t display the team logos, score, team record, nor additional game metadata. This same component is also referred to as the non-sports data component.
The non-sports data components display when:
rich sports data doesn’t exist for an event
data exists for an event, but hasn’t been linked in the database to the event yet
component UI
Because of the combination of the scores and schedule pages on native, UI updates were made to the former native schedule component to create unison with newer scores component. This was intended to create a seamless page design within the existing environment.
These changes were applied globally to all non-sports-data-enhanced scores/schedule components on the iOS and Android apps.
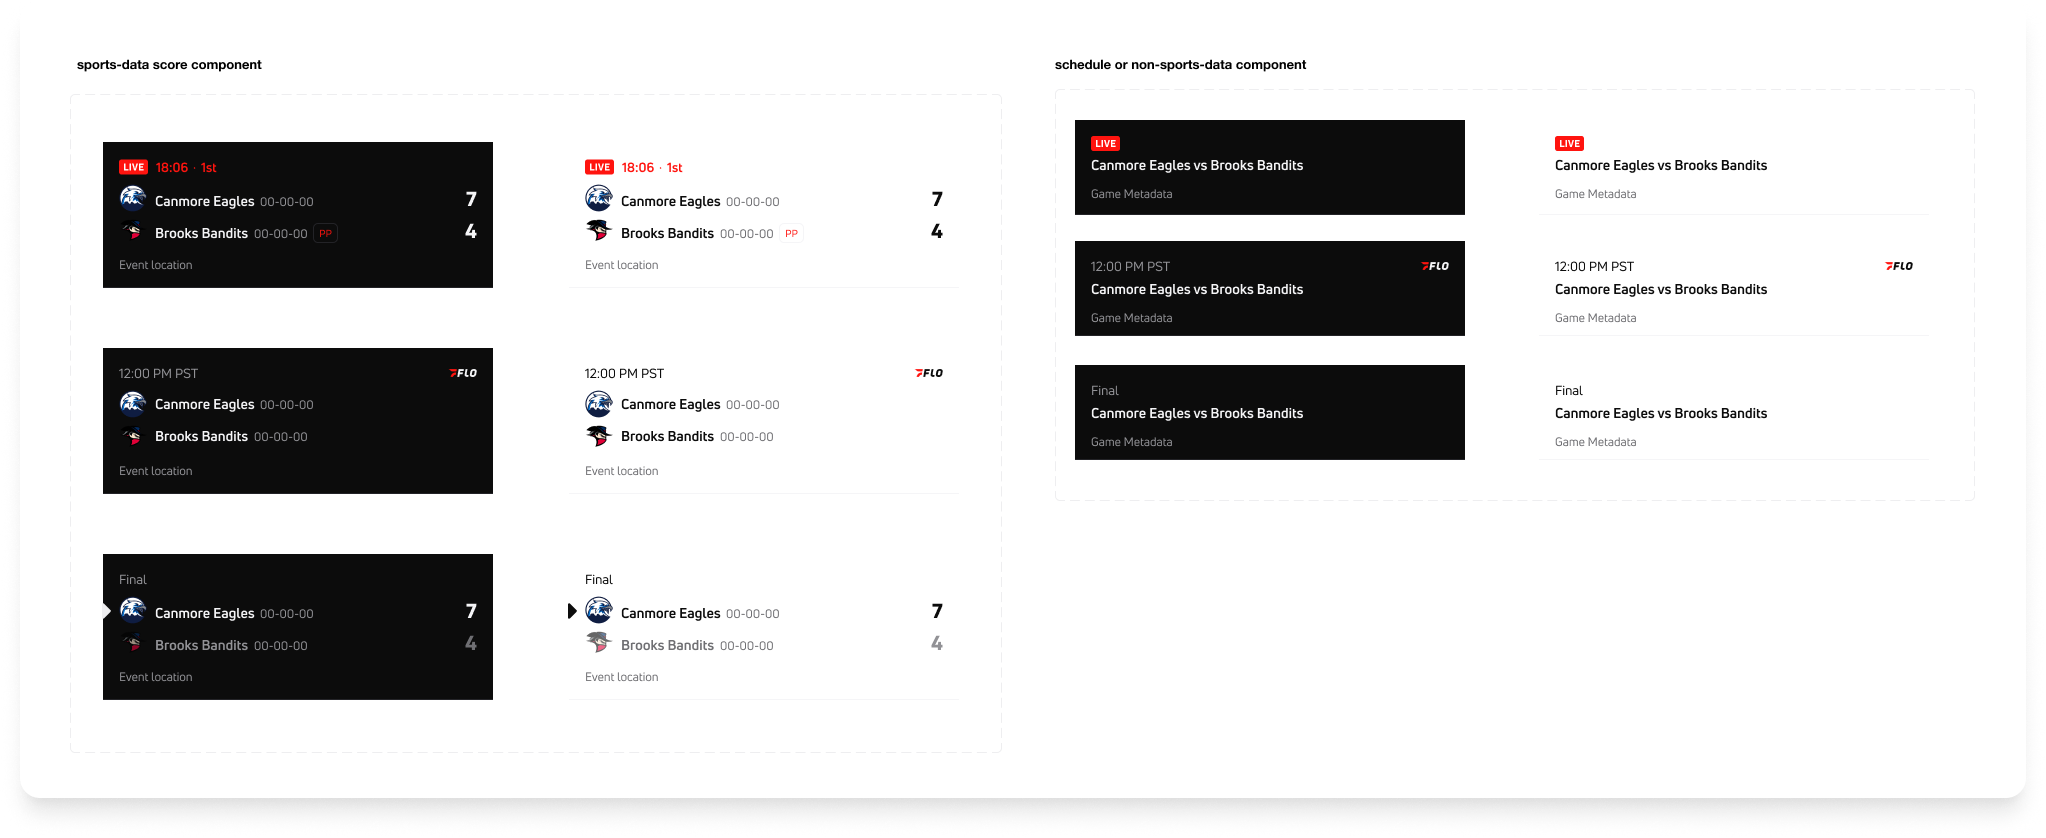
Rich sports-data components (left) beside non-data schedule components (right) in light & dark themes
Light & Dark theme variants
As shown above, both light and dark themes were designed for these components as we develop our product to support both modes.
Teams and Leagues
Teams
Below are are native designs for the teams scores tabs. Similar to the web designs, these screens display a header and tab navigation for the collection. Within the scores tab, the user can filter scores/events by season, and toggle between completed or live/upcoming events. The user also has the ability to favorite this collection at any time above the header.
On a Live & Upcoming tab, events are displayed in chronological order, beginning with Live. On the Completed tab, events are listed in reverse chronological order.
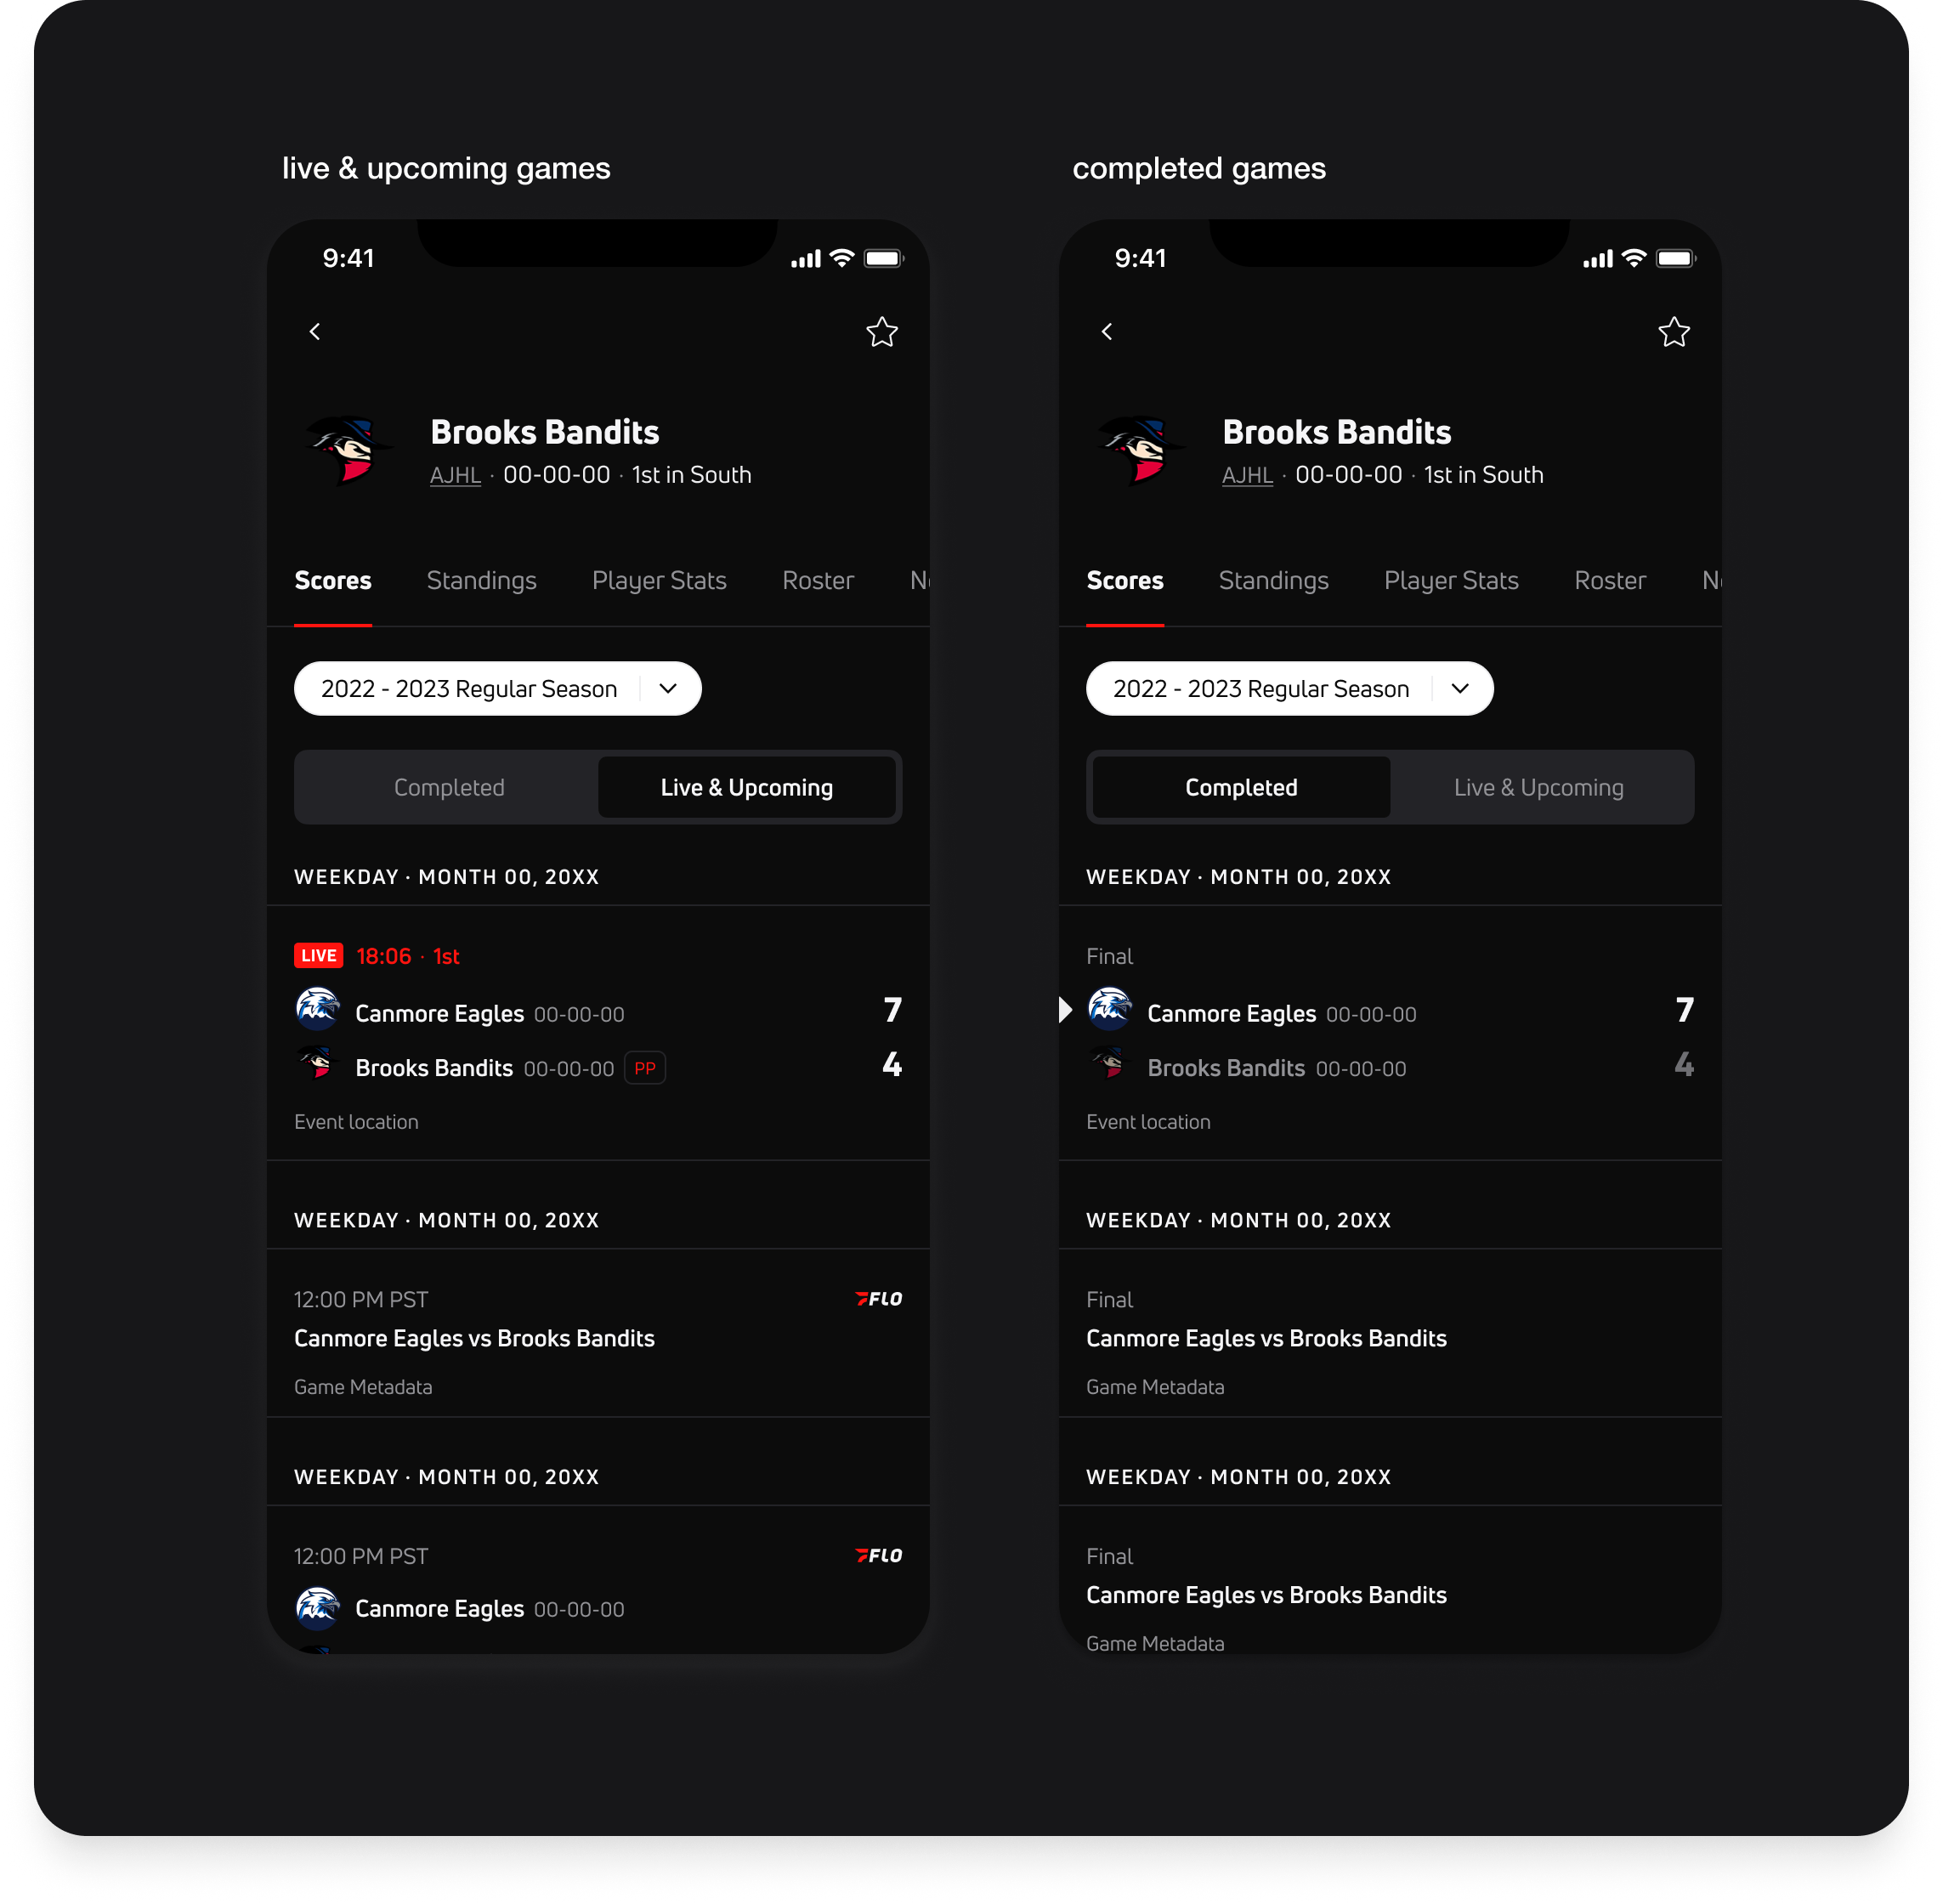
Teams screen for Live & Upcoming tab (left) and Completed tab (right)
Aside from a dark theme, the main difference between the web and native teams display is the addition of the non-sports-data schedule components within this view. This is also shown within the Leagues score screen below.
Leagues
The structure of the leagues page is very similar to the teams page. The main difference here exists with the schedule interaction — calendar/date picker component.
Because leagues feature a greater number of events on a daily basis, a calendar picker is the more appropriate navigation tool. The user also has the option to select a specific day without having to tediously scroll through the date picker using a calendar. This calendar icon is present in the top right of the screen, besides the favoriting icon. When the user changes tabs (to a Teams page for instance), this icon doesn’t display.
Additionally, there is no toggle navigation on the leagues page, as seen on the teams page. The events are displayed in chronological order, from Live to Upcoming to Completed for any given day.
This navigational structure holds true for leagues and their governing bodies, or parent leagues, as more events exist within that heirachy.
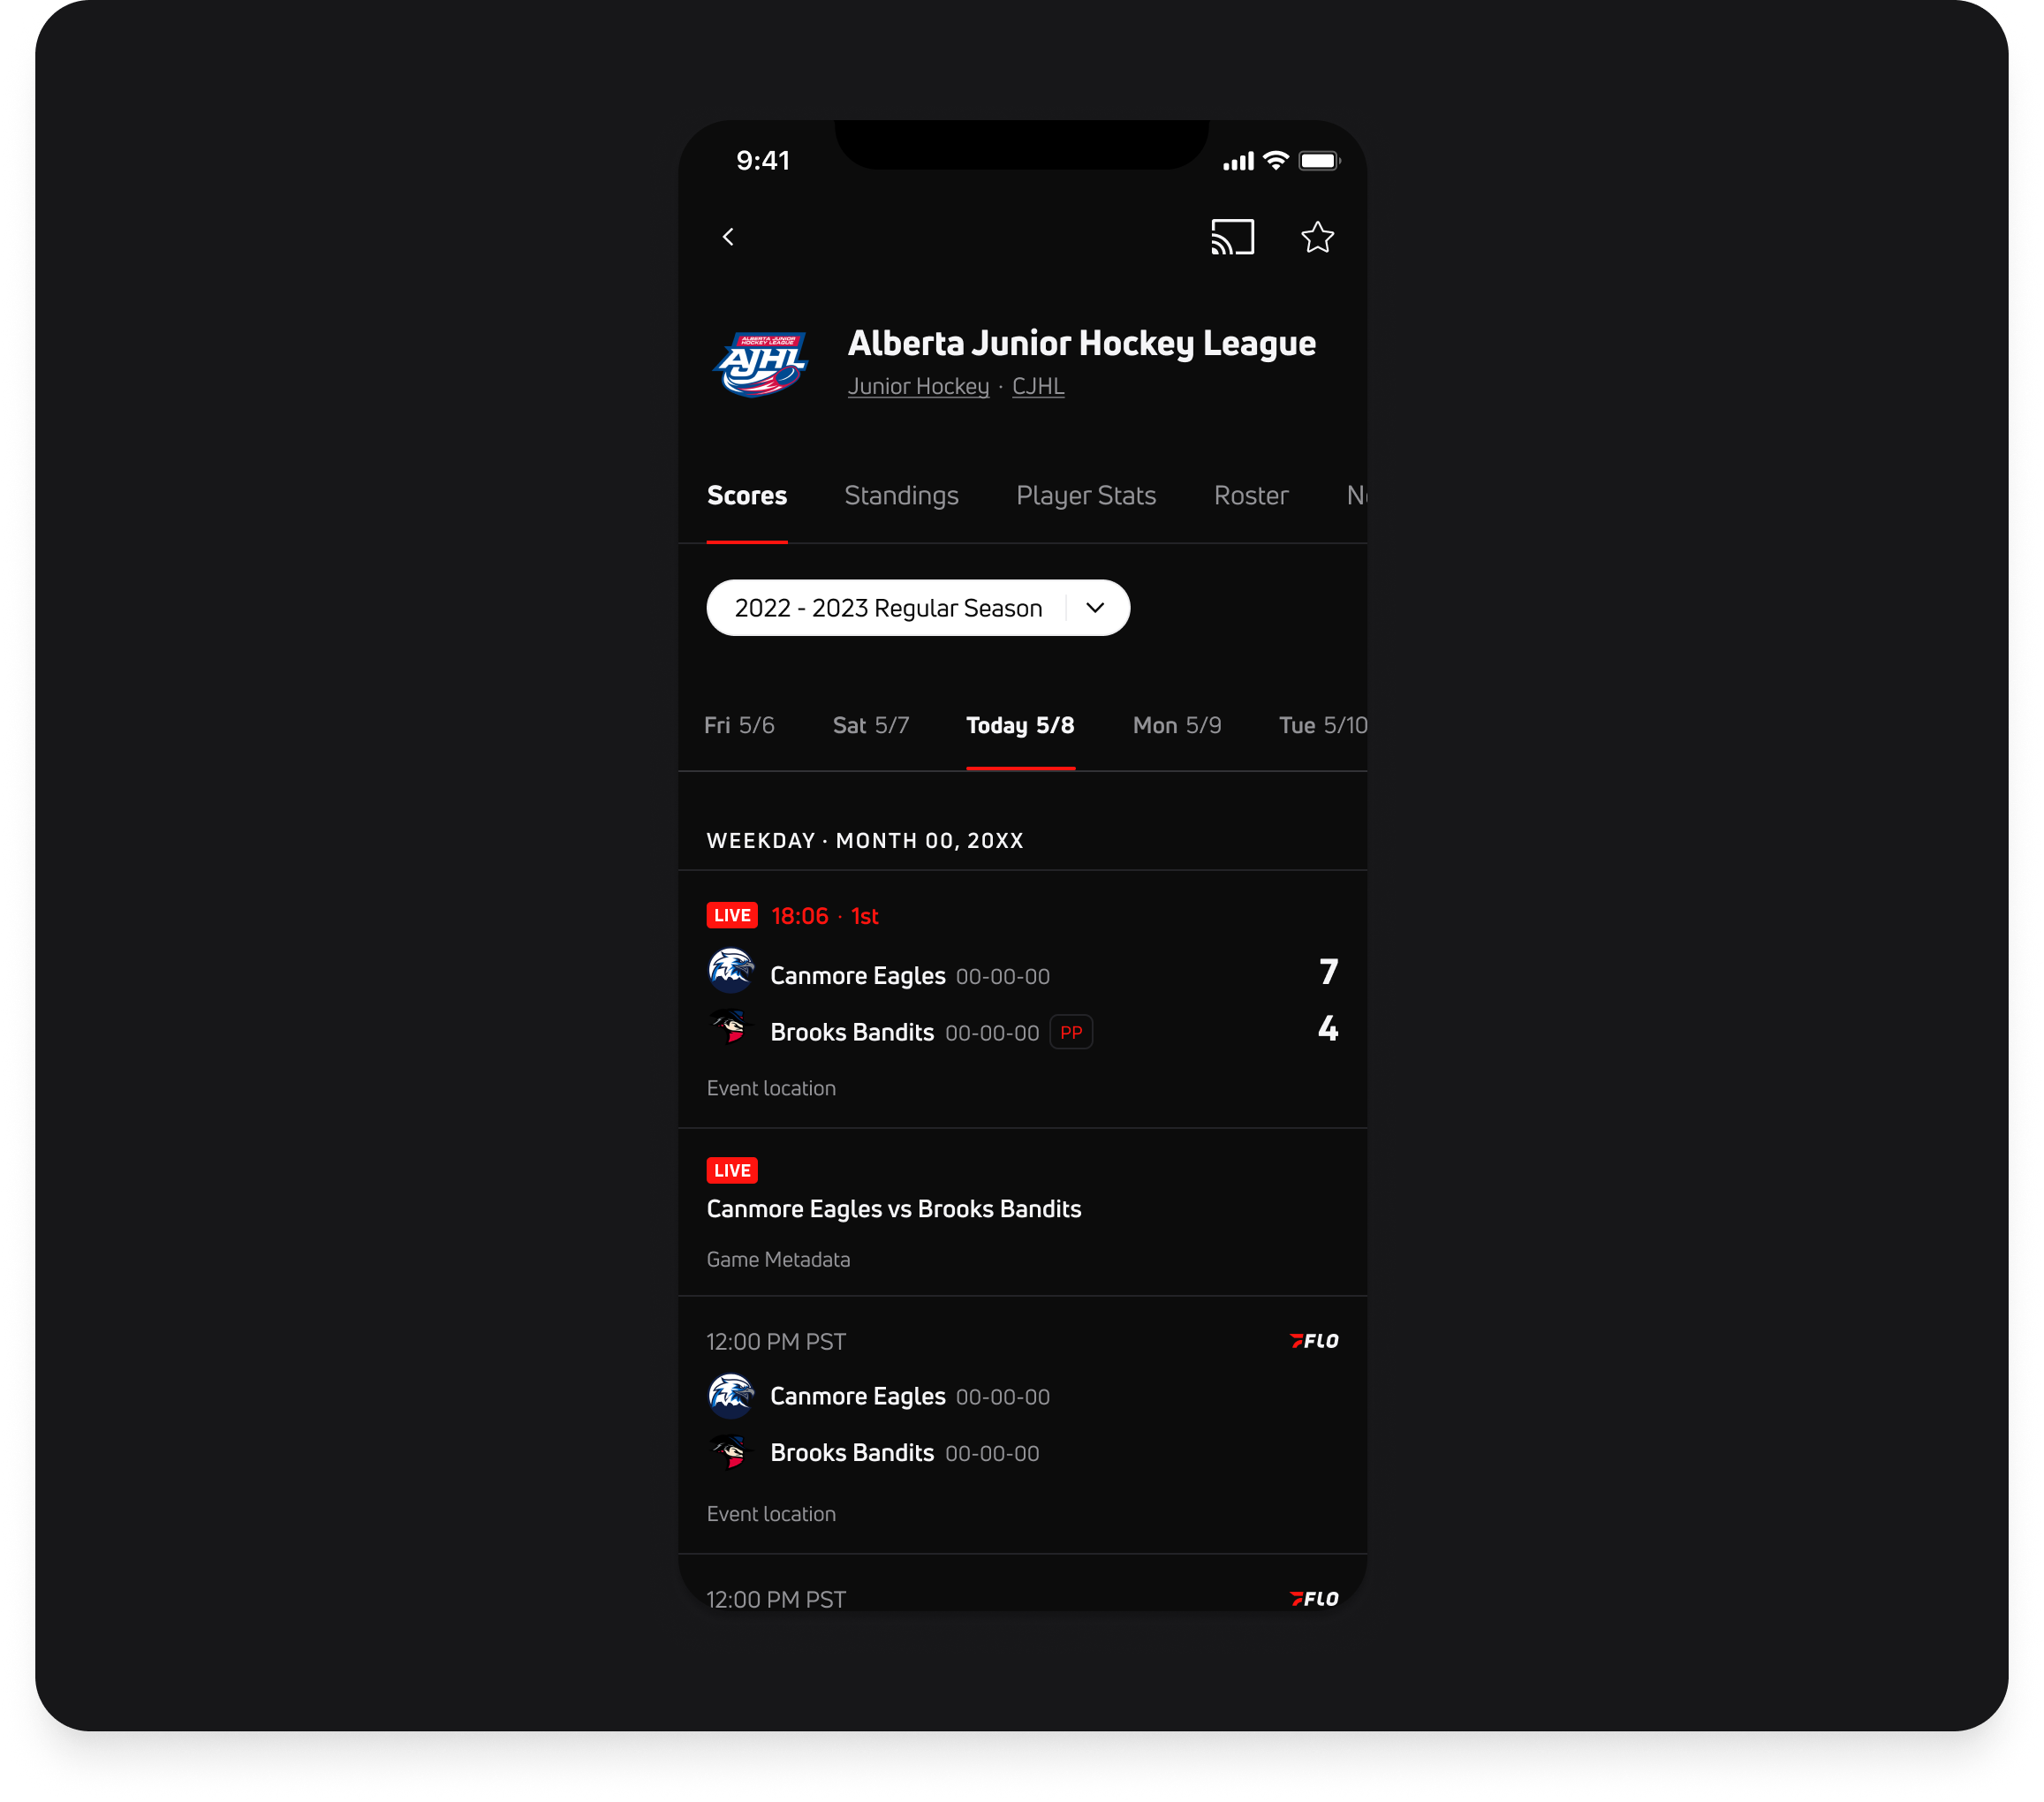
Leagues iOS screen
Season Filter
The only filter displayed on the Scores tab (for both teams and leagues) is the season filter. Below is an example of how this native interaction occurs when switching seasons.
This season filter is default preselected to the current, or most recent season. This filter can never be unselected.
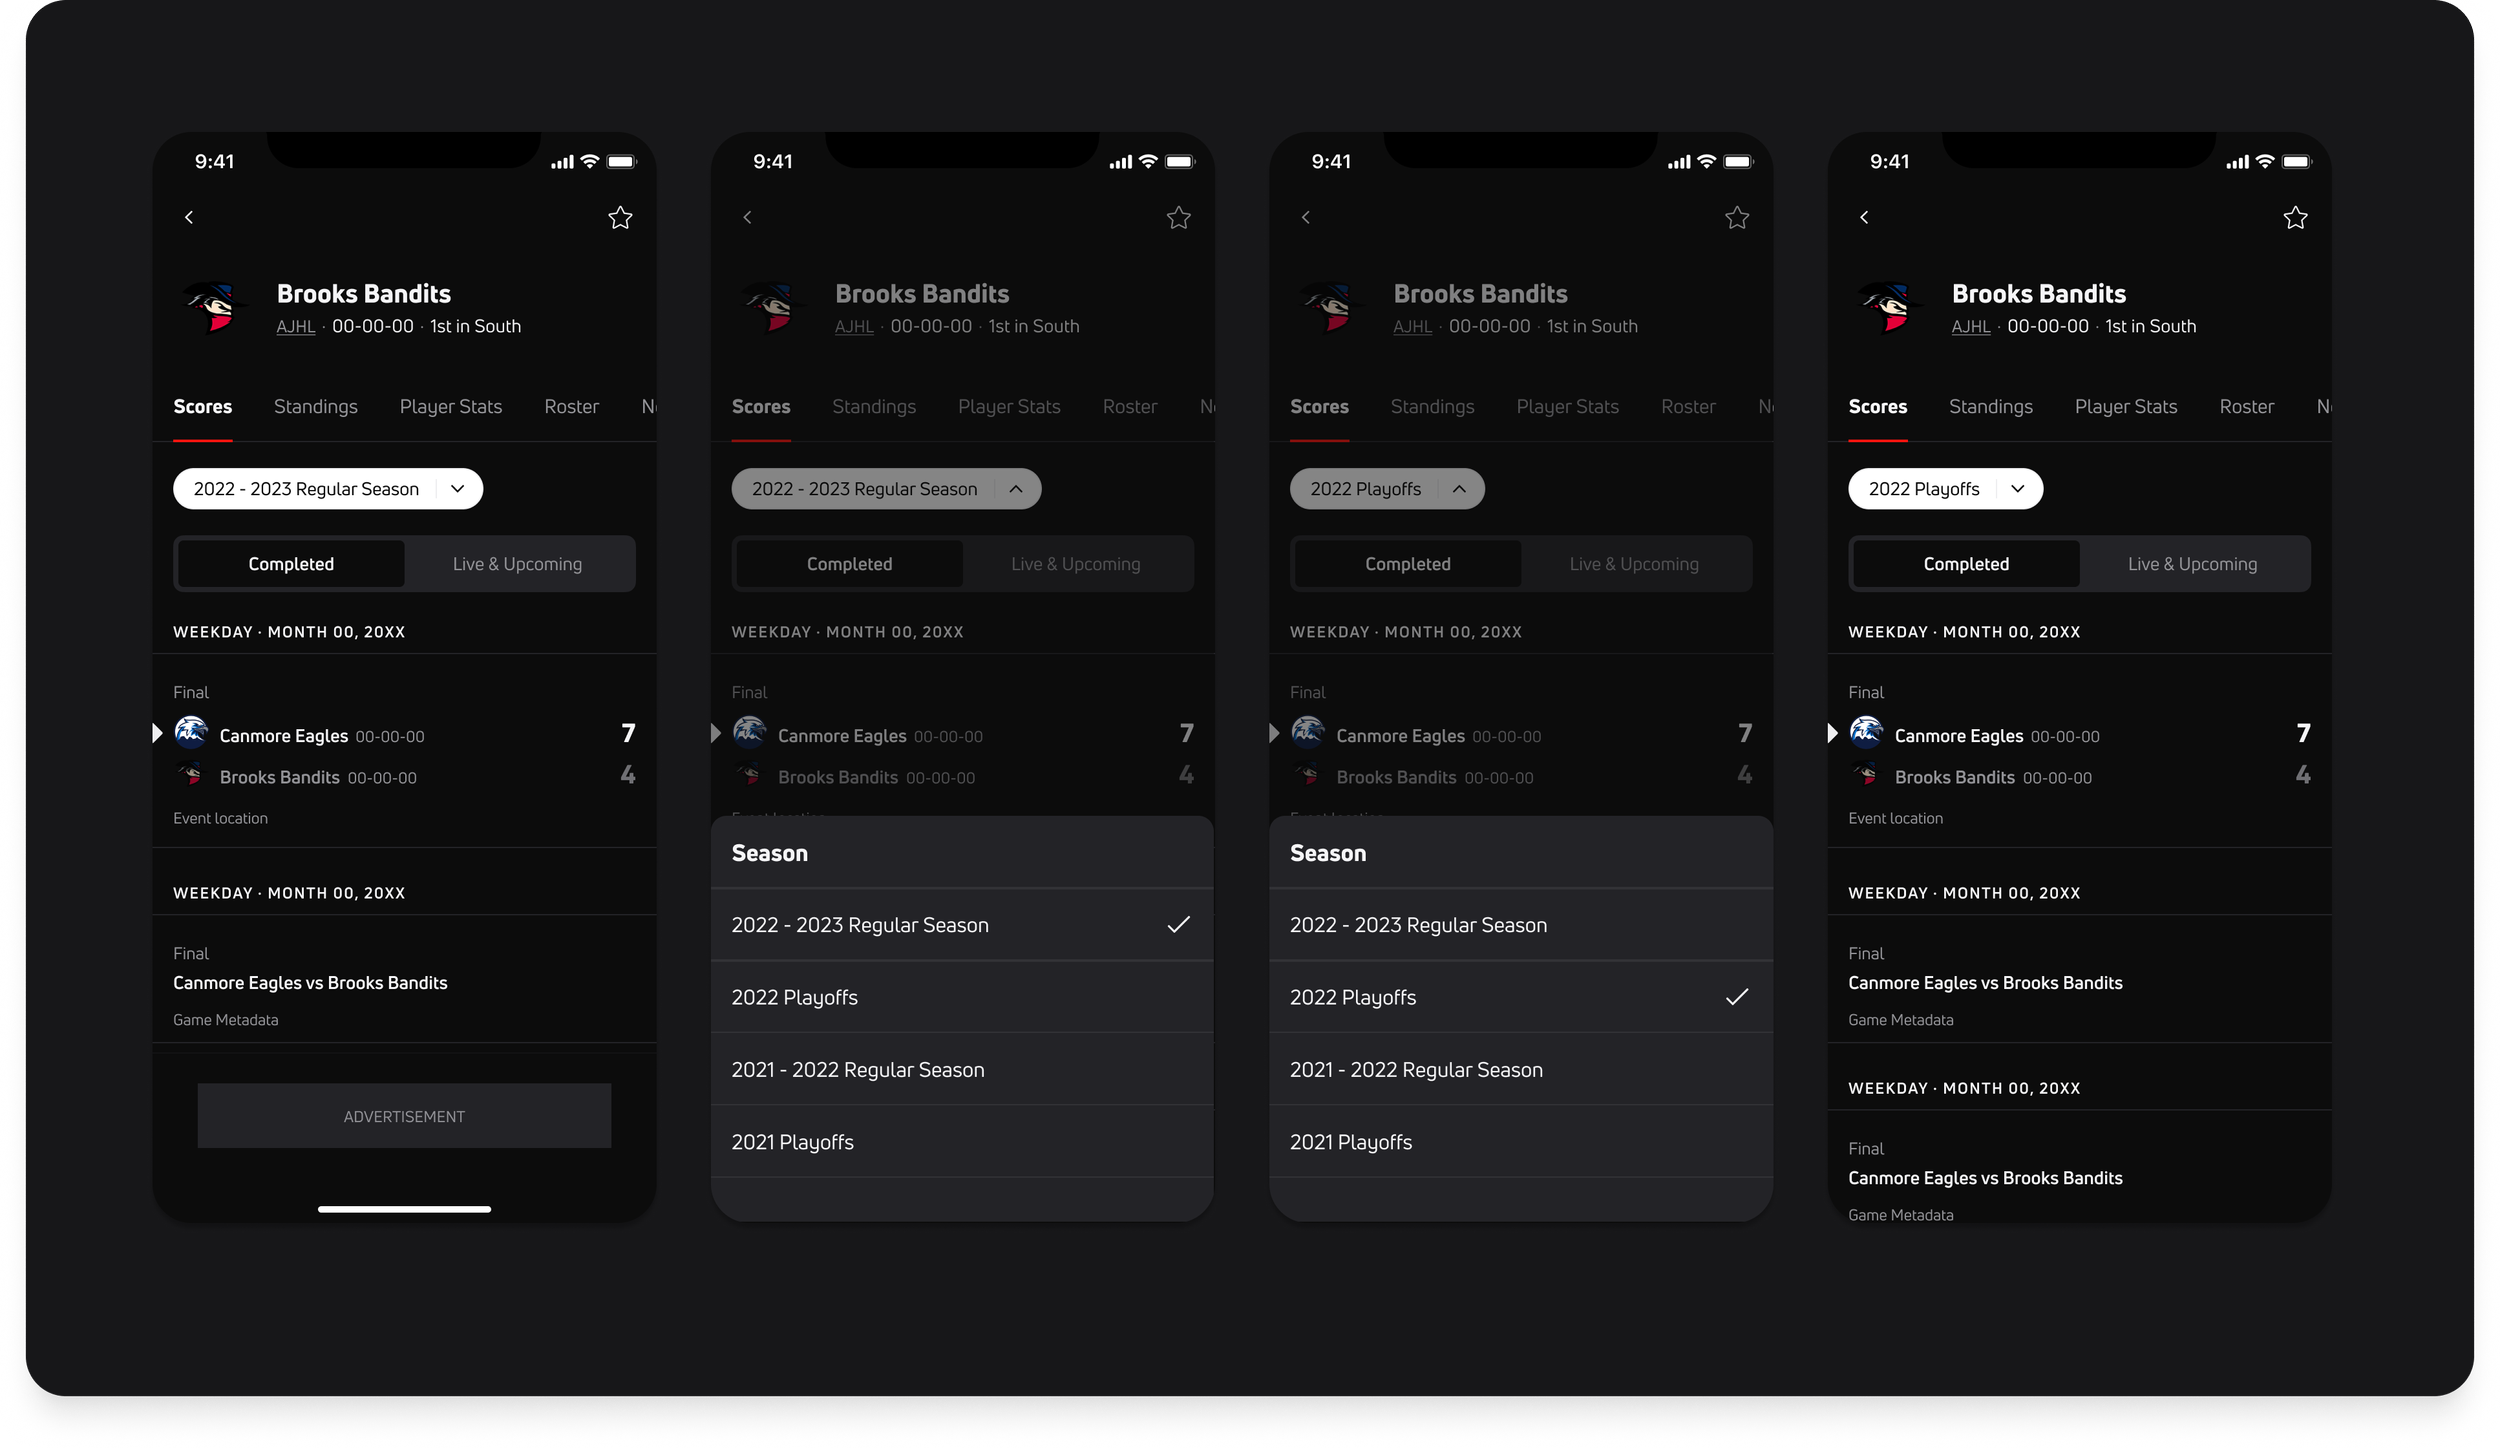
Native app filters flow
additional UI
Pagination
For the native experience, pagination will exist after ~15/20 events with a “See More” button. Selecting this button loads the next 15 results. On web, we introduced a numerical pagination scroll for individual page selection.
outcome
These Scores (+Schedule on iOS) experience is currently in in development on the front-end teams with continuous design QA as progress is made, and sprints are completed. The production release of this work is planned for Summer of 2023.